Power to the Plant Manager
Plant managers keep the lines running and already know what to fix. Here is how to turn that floor knowledge into numbers finance will approve.
LineIQ Team8 min read
Every bottle of shampoo, box of cereal, and case of soda on a store shelf got there because a packaging line ran. And behind almost every line that runs well is a plant manager who made it happen.
They rarely get the credit. When a line hits its numbers, nobody notices. When it goes down, everybody does. The plant manager lives in that gap: covering short-staffed shifts, juggling changeovers, chasing parts, and keeping product moving so the trucks leave on time.
This post is for them.
They already know where the line is losing
Spend an hour on the floor with a good plant manager and you will hear things no dashboard tells you.
- "The labeler jams every time we run the tall bottle."
- "The case packer is fine. It just starves because nothing upstream can keep up."
- "If we had a little more space after the filler, half of these stoppages would never reach the end of the line."
That knowledge comes from years of watching the same machines, hearing them change pitch before they fault, and knowing which operator can clear a jam in 30 seconds and which one needs five minutes. It is usually right.
Already know which machine is holding your line back? Put a number on it in LineIQ. It takes a few minutes with figures your team already tracks.
The problem is not knowing what to fix. The problem is getting someone to pay for it.
Where good ideas go to die
Capital requests do not get approved on instinct. Finance teams want to know three things:
- How much more will we produce?
- What is that worth per year?
- How long until it pays for itself?
"Trust me, the labeler is killing us" does not answer any of them. So the request gets pushed to next quarter, then next year. Meanwhile the line keeps losing the same minutes every shift, and the plant manager keeps working around a problem they already know how to solve.
It is not that management does not trust the plant manager. It is that they have to compare this request against ten others, and the ones with numbers attached usually win.
Turning floor knowledge into a business case
The good news is that the numbers are already in the plant manager's head. They just need to be put through the right math.
LineIQ was built for exactly this. You enter what you already know about each machine: its rated speed, how often it stops, and how long a typical stop takes. LineIQ turns that into availability, finds the real bottleneck, shows what the line actually produces, and prices out the fixes, including where an accumulator would pay off most.
Here is what that looks like, using a real line in the calculator.
A worked example
Take a typical bottle line running two 8-hour shifts a day, 250 days a year. A depalletizer feeds a filler, then a labeler and a case packer, with no buffers between them:
| Machine | Rated speed | Stops per hour | Minutes per stop | Downtime per shift | Availability |
|---|---|---|---|---|---|
| Depalletizer | 300 / min | 1 | 1.2 | 9.6 min | 98.0% |
| Filler / capper (monoblock) | 200 / min | 1 | 3 | 24 min | 95.0% |
| Labeler | 250 / min | 3 | 3 | 72 min | 85.0% |
| Case packer | 300 / min | 2 | 2.4 | 38.4 min | 92.0% |
Each availability is simple arithmetic. The labeler stops 3 times an hour, so 24 times in an 8-hour shift. At 3 minutes each, that is 72 minutes lost. Availability is (480 - 72) / 480 = 85%.
Notice the speeds. Like most real lines, the machines around the filler are built to run faster than it, so they can catch up after a stop. But catching up needs somewhere to put the bottles, and this line has no buffers. So every stop on any machine stops the whole line, and the line can never run faster than its slowest machine: the filler, at 200 a minute.
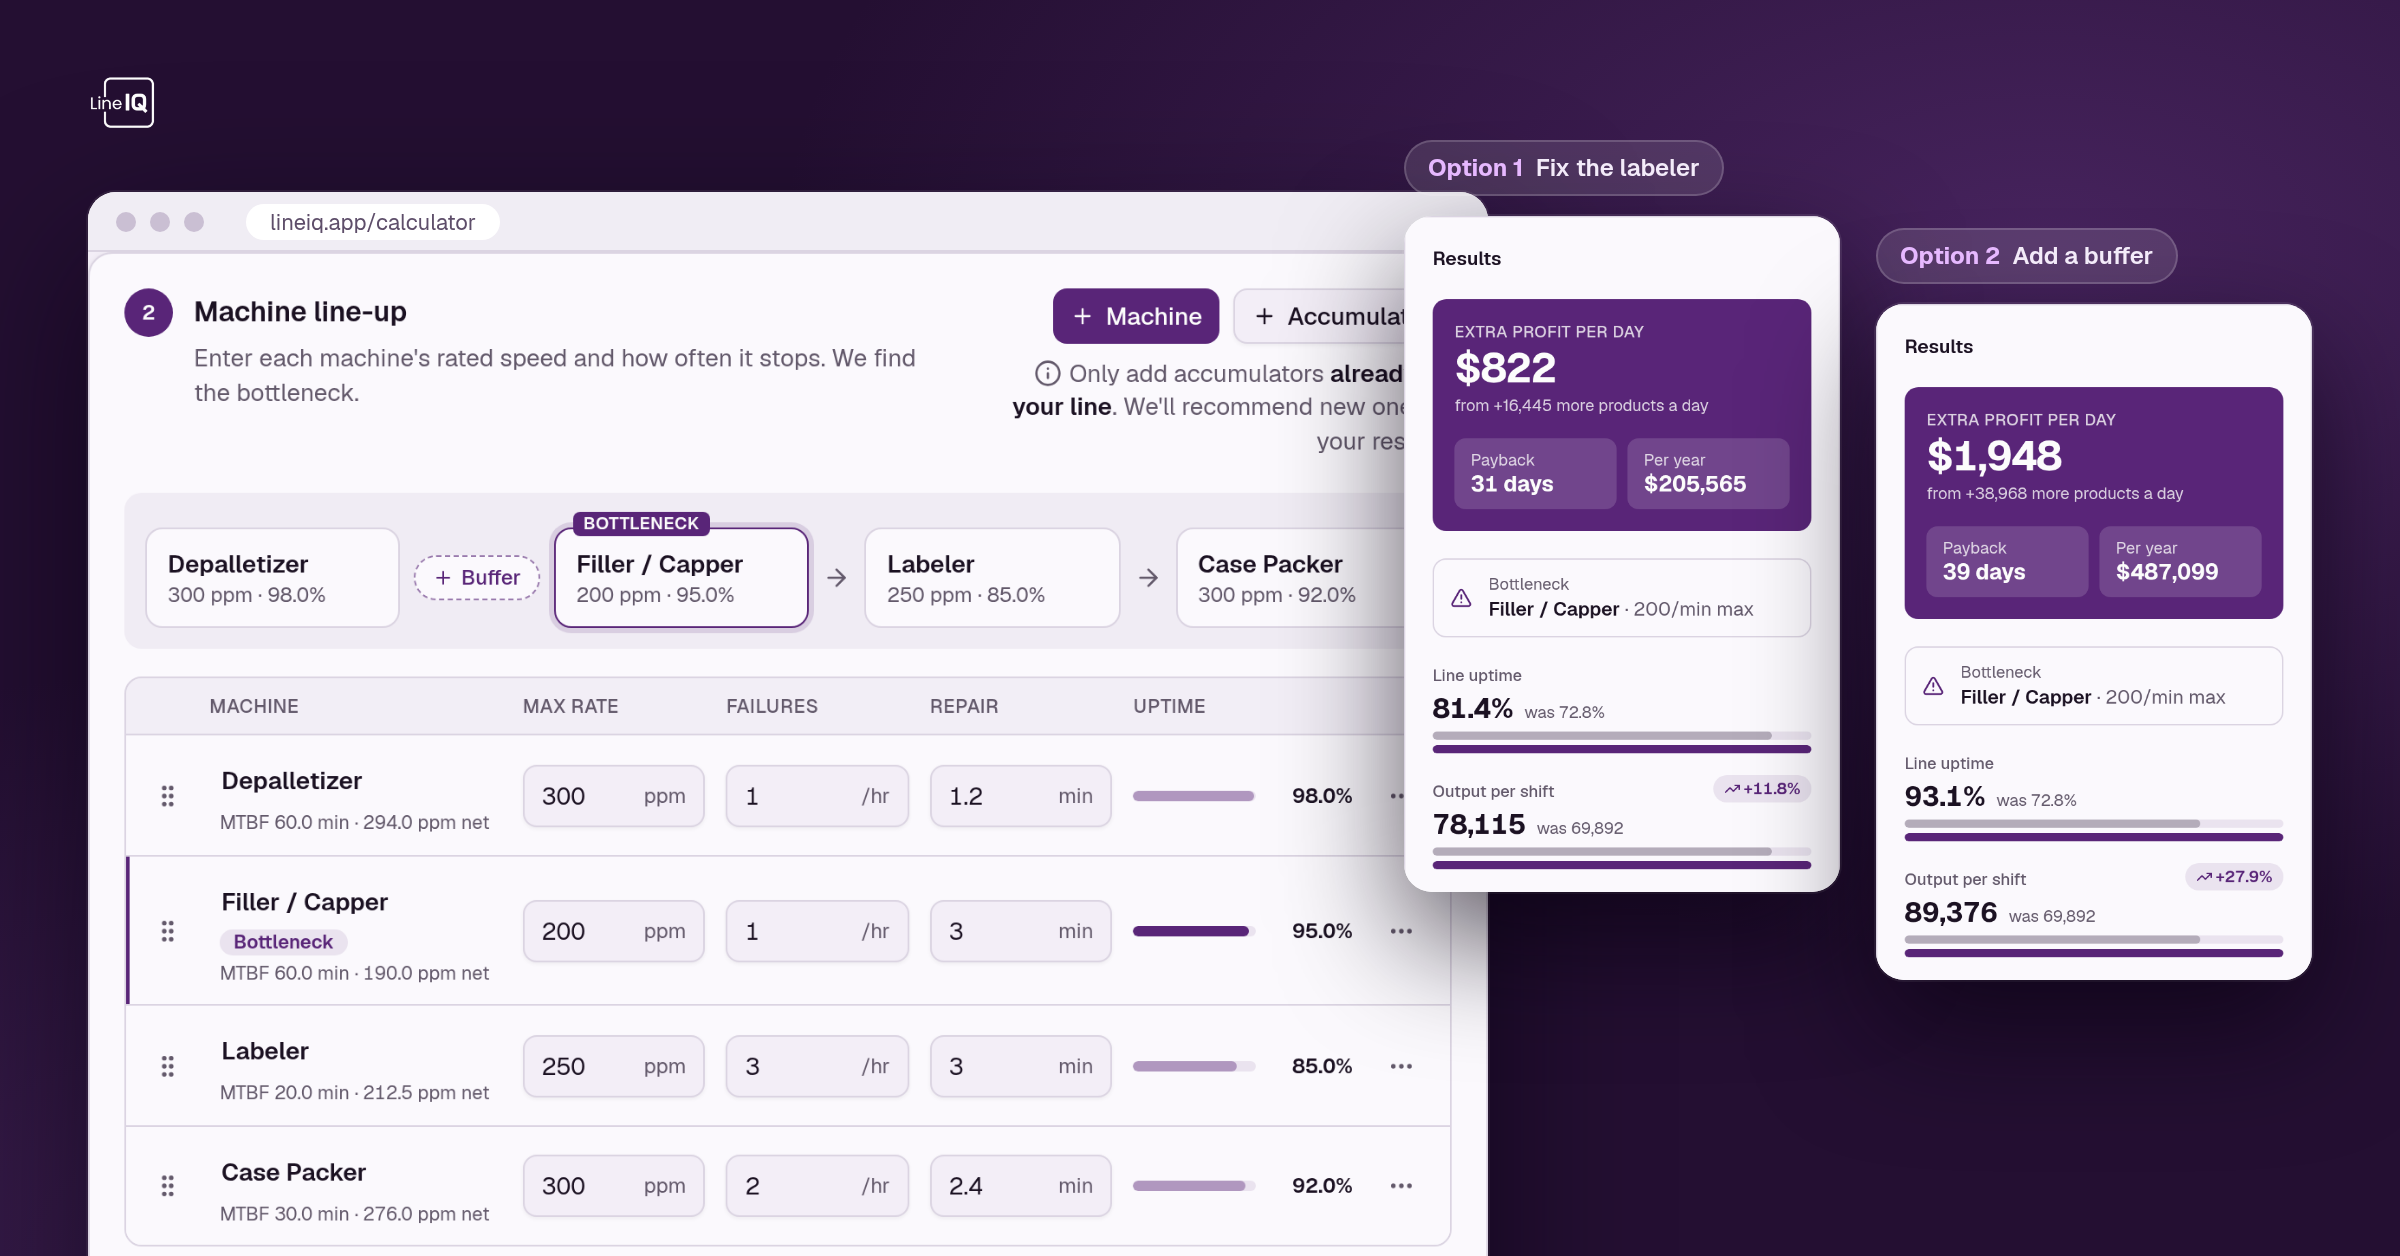
Here is that same line entered in LineIQ. Four rows, three numbers each.
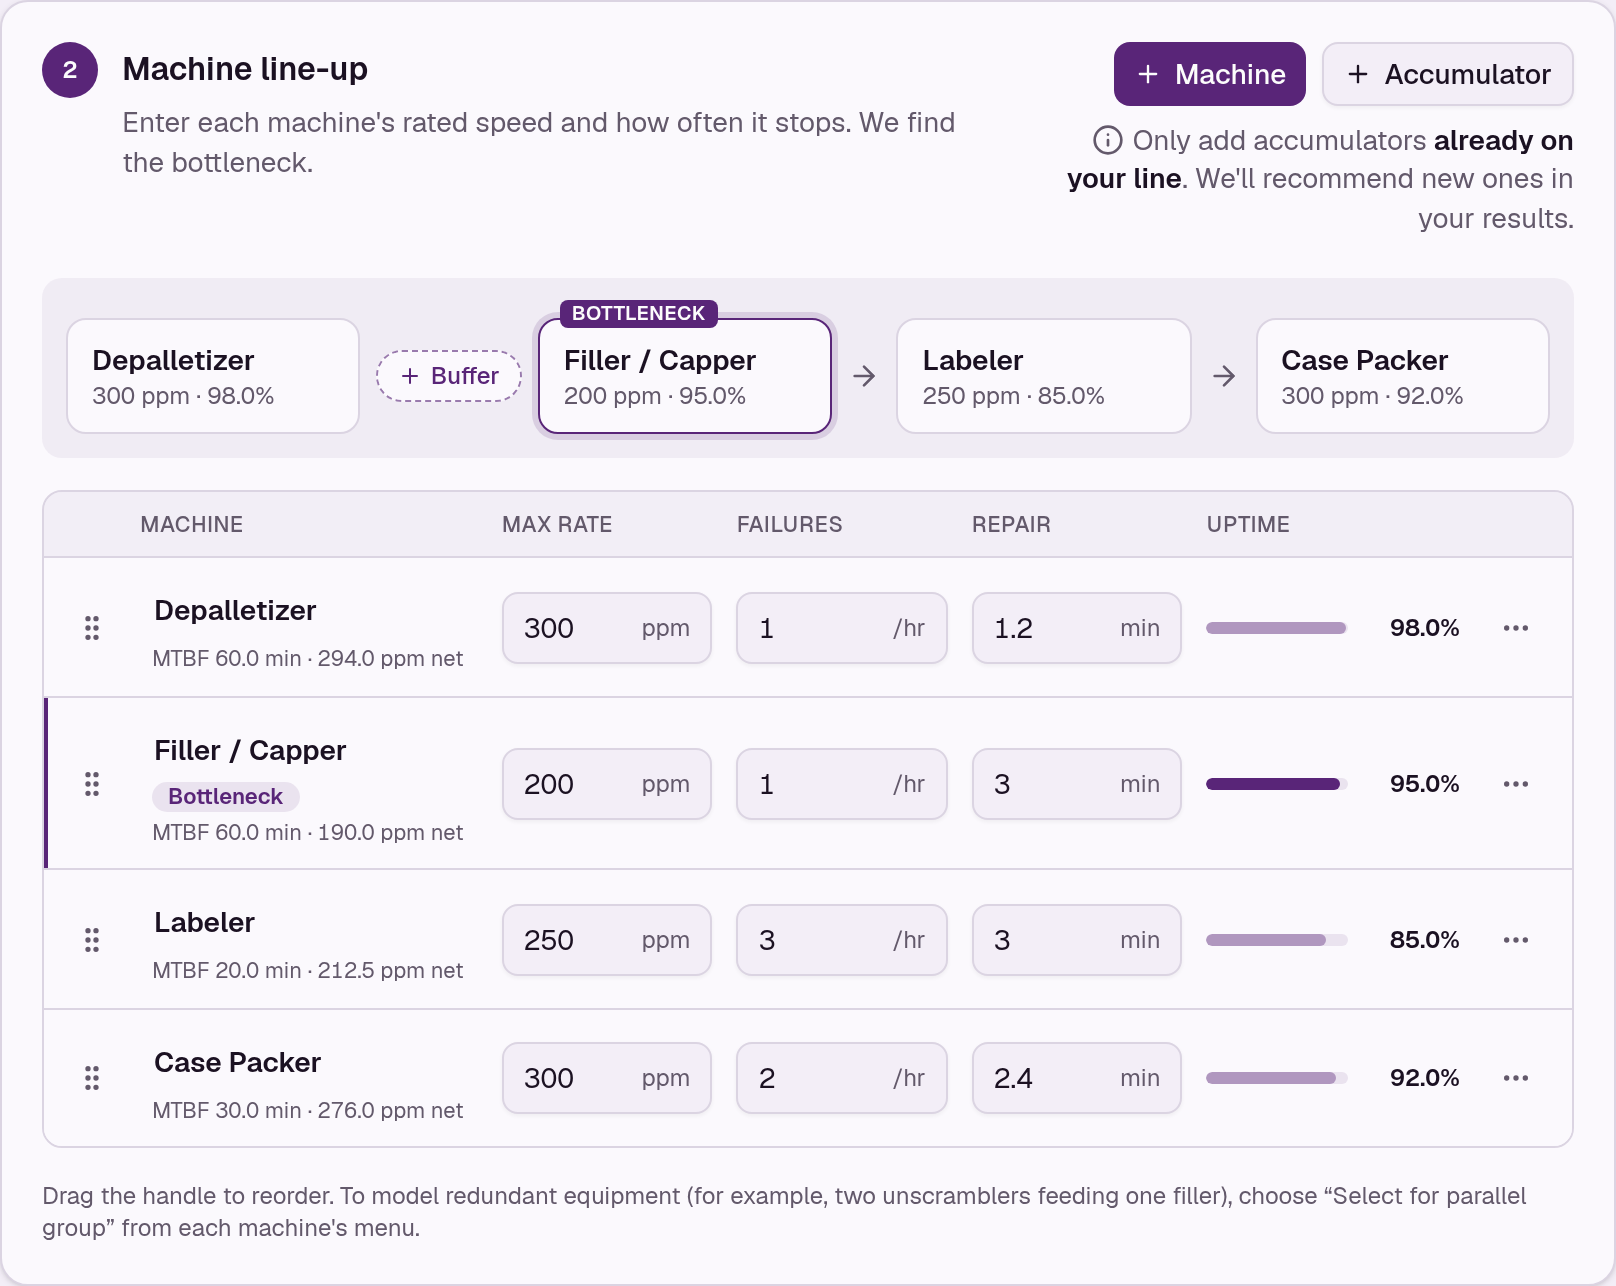
LineIQ flags the filler as the bottleneck, because it sets the pace. But look at where the time goes: the labeler loses 72 minutes a shift, three times what the filler loses. Any plant manager would recognize this line. The filler sets the speed, and the labeler keeps stopping it.
With no buffers, the line's uptime is all four availabilities multiplied together:
0.98 x 0.95 x 0.85 x 0.92 = 72.8%
So a line paced at 200 bottles a minute really averages about 146. That is about 69,900 bottles a shift.
The plant manager has two ideas for winning that time back. Let's price both.
Option 1: Fix the labeler
The plant manager knows the labeler's jams could be cleared in 1 minute instead of 3, with a better change part and a quick-release guide. Its downtime drops to 24 minutes a shift, and its availability rises to 95%.
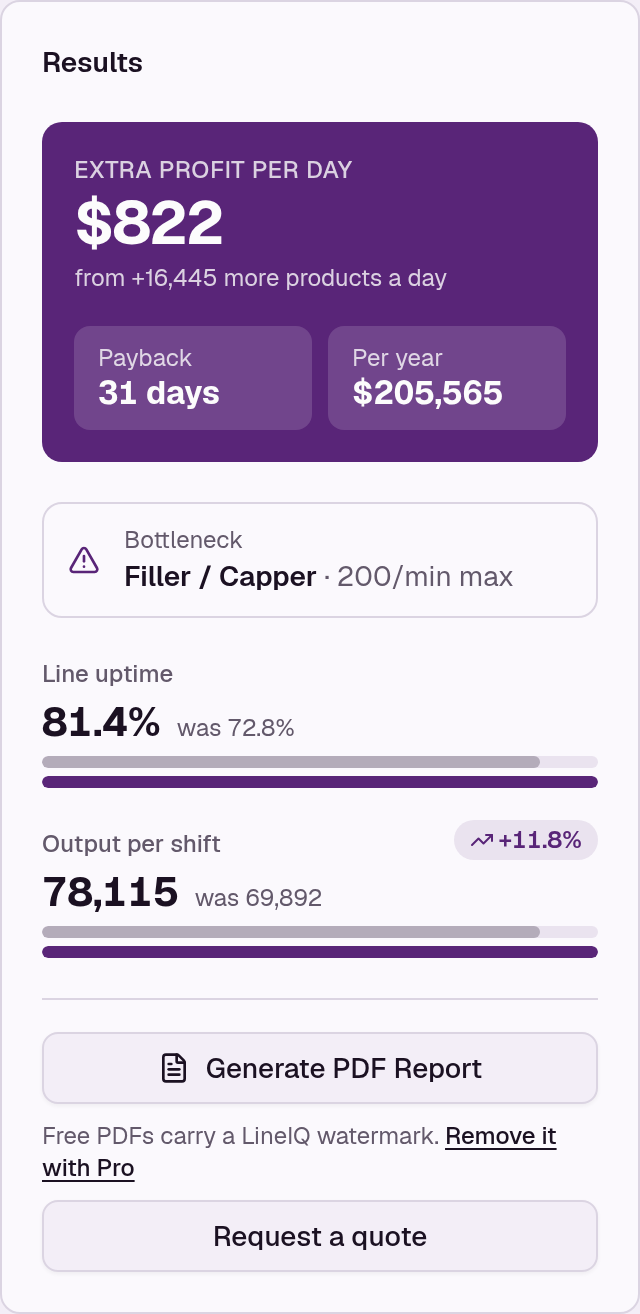
0.98 x 0.95 x 0.95 x 0.92 = 81.4%
The line now averages about 163 bottles a minute, which works out to about 8,220 more bottles per shift. At 5 cents of margin per bottle, that is roughly $205,000 a year. With a placeholder cost of $25,000, it pays back in about 31 days.
Option 2: Add an accumulator after the filler
Remember the third quote from the floor: "If we had a little more space after the filler, half of these stoppages would never reach the end of the line." LineIQ can test that directly. It checks every spot on the line where an accumulator could go and ranks them by how much output each one wins back.
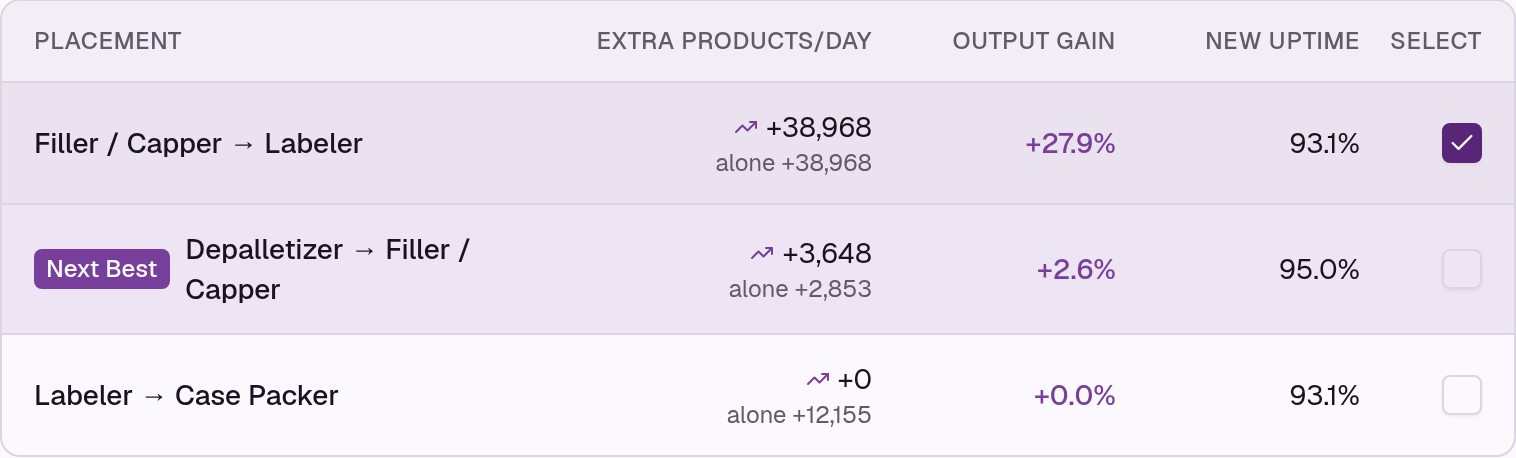
The best spot is between the filler and the labeler, exactly where the plant manager pointed. Here is why it works so well:
- The filler keeps running when the labeler jams. Bottles collect in the buffer instead of backing up into the filler and stopping it.
- The labeler catches up. It is rated at 250 a minute, 25% faster than the filler, so once the jam is cleared it drains the buffer before the next stop.
- The labeler's stops stop reaching the bottleneck. The line now loses time only when the depalletizer or the filler goes down.
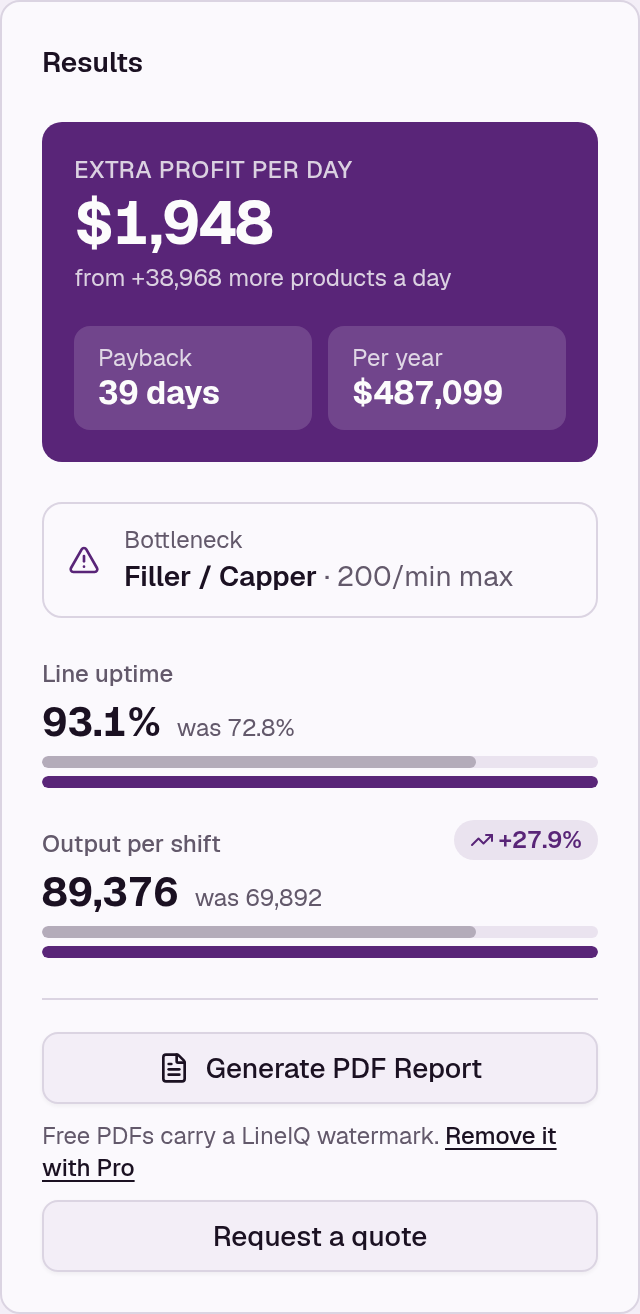
That one buffer lifts the line to 93.1% uptime and 27.9% more output, about 19,480 more bottles a shift. That is worth roughly $487,000 a year. With a placeholder cost of $75,000, it pays back in about 39 days.
Side by side
| Option 1: Fix the labeler | Option 2: Add an accumulator | |
|---|---|---|
| Cost (placeholder) | $25,000 | $75,000 |
| Line uptime | 81.4% | 93.1% |
| Extra bottles per shift | about 8,220 | about 19,480 |
| Extra profit per year | about $205,000 | about $487,000 |
| Payback | about 31 days | about 39 days |
The labeler fix pays back a little faster. The accumulator earns more than twice as much every year. That is a conversation worth having with finance, and it is one you can only have when both options have been priced the same way.
There is one more thing the math shows. Once the accumulator is in, fixing the labeler adds nothing. The labeler already catches up after every jam, and the filler is the limit again. Doing both would cost $25,000 more for no extra output. That is exactly the kind of thing you want to know before you spend the money, not after.
Open either option and change any number to see how the results move. No account needed to look around.
What changes when the numbers are on the table
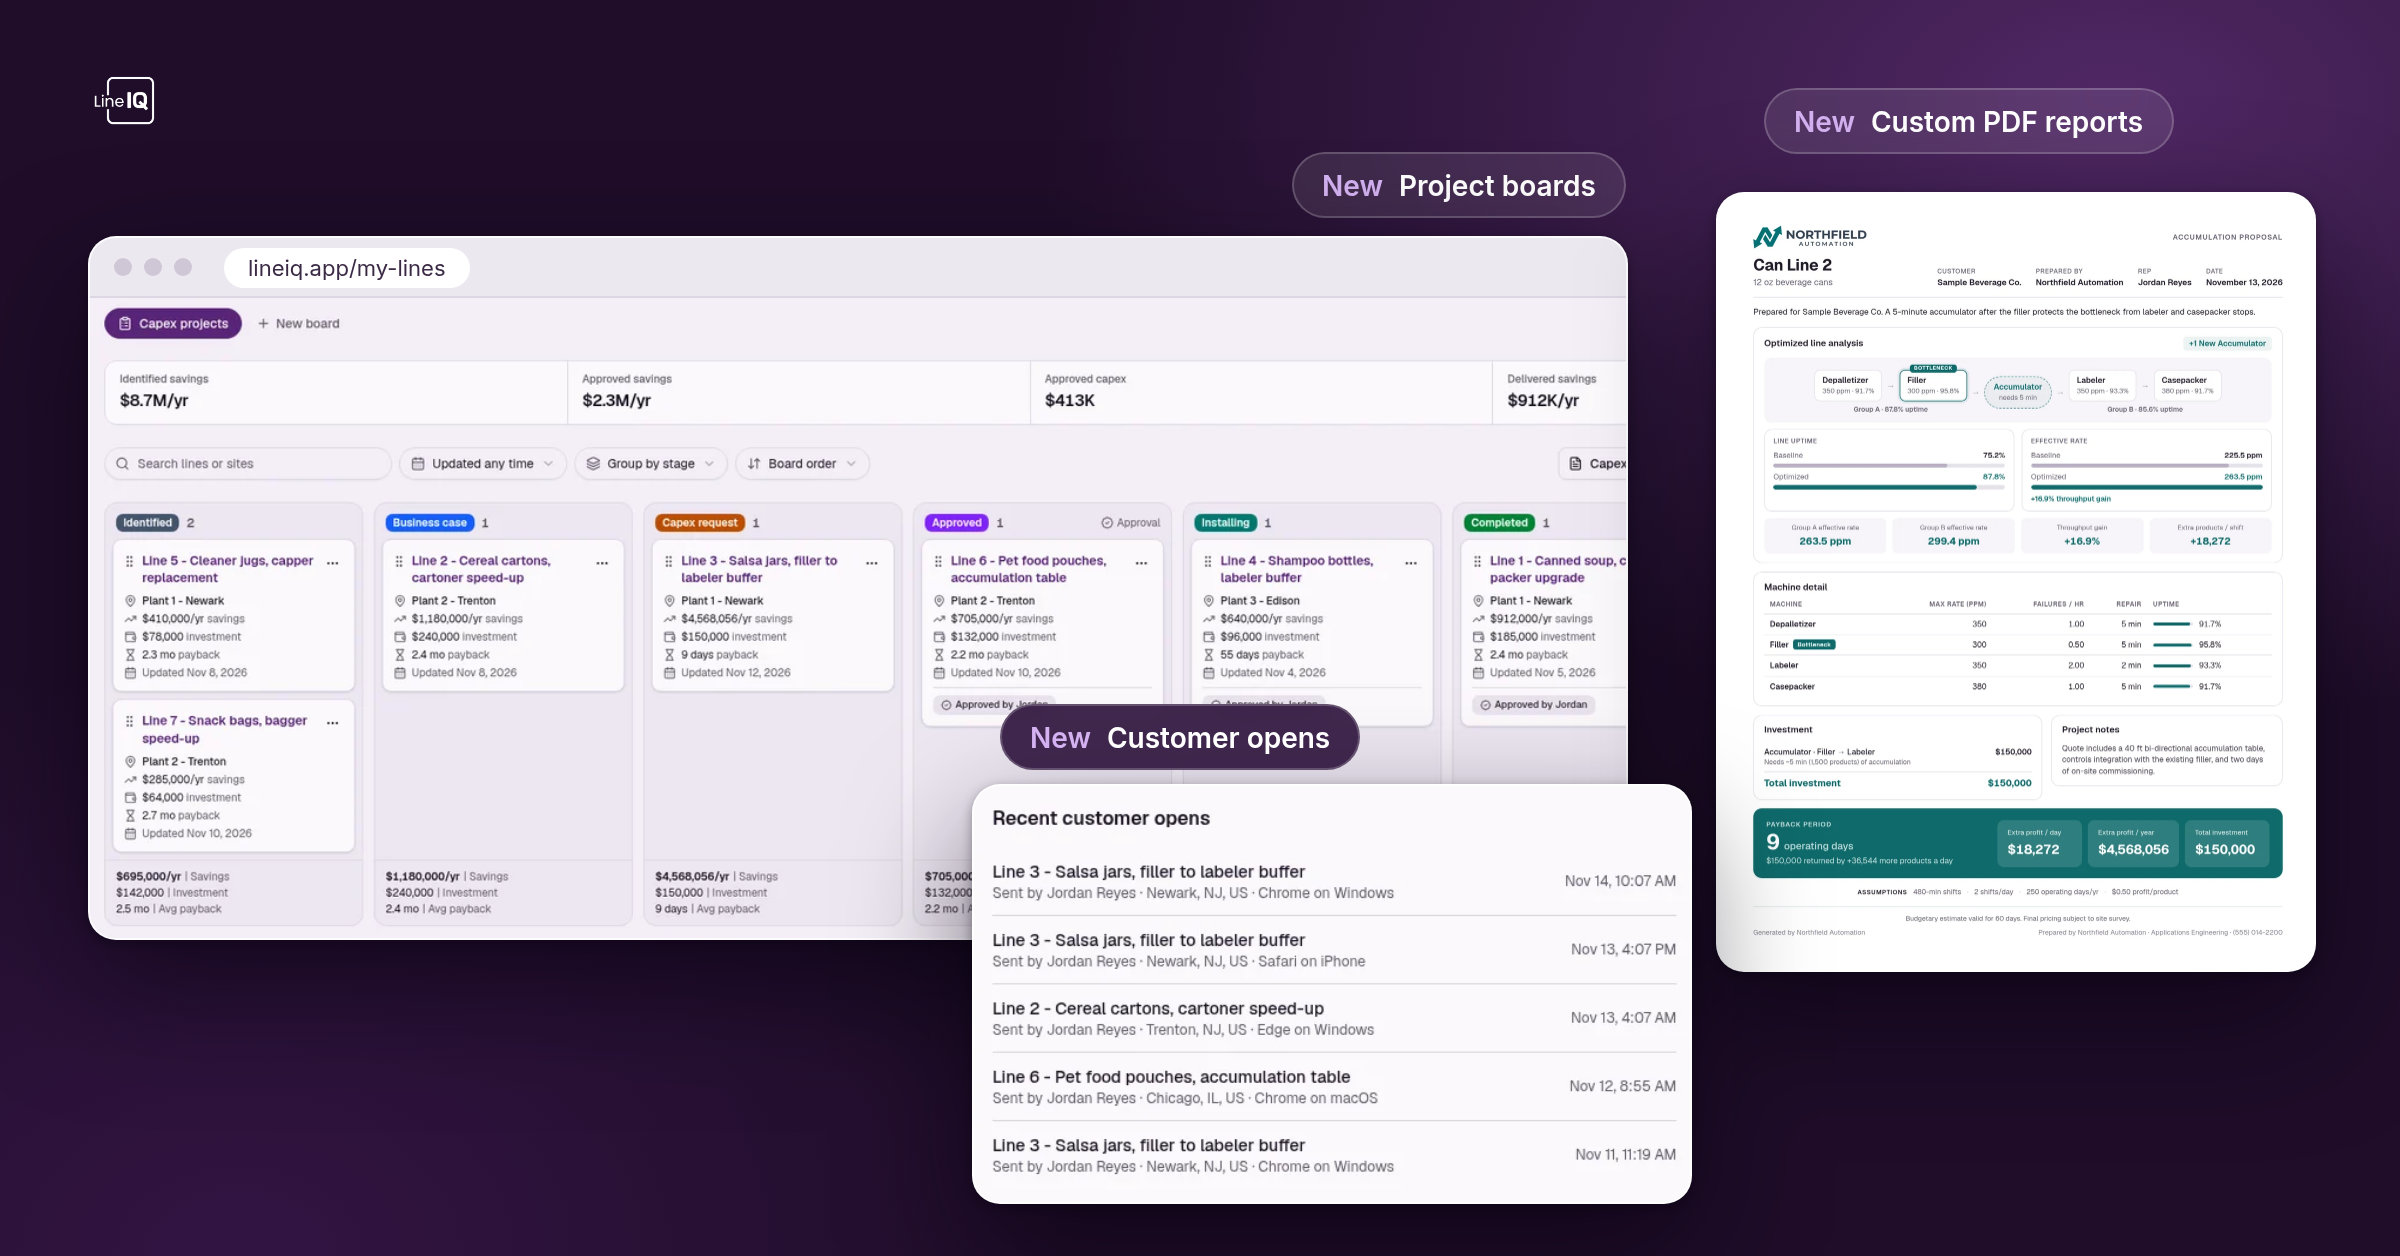
When a plant manager walks into a capital meeting with a LineIQ report, the conversation changes.
- It is not a hunch anymore. The output, the yearly value, and the payback are on one page, with the math shown.
- It compares options fairly. Fix a machine, add a buffer, or both? Each one is priced the same way, so the best choice is clear.
- It speaks finance's language. Profit per year and payback period, not "it jams a lot."
- It keeps the credit where it belongs. The insight came from the floor. The report just proves it.
The plant manager's knowledge was always the valuable part. LineIQ gives it a format the rest of the business can say yes to.
Try it on your own line
You do not need perfect data to start. Use the stops and repair times your team already tracks, or your best estimates from the floor. Most people can model a line in a few minutes.
Model your line in the LineIQ calculator and see which fix is really worth the money.