
For plants and operations teams
Know what's holding your line back, and prove the fix pays off.
For plant managers, continuous-improvement leads and packaging engineers. Model the line as it really runs, find the true constraint, and take one payback period to your capital review.
- Free account, no credit card
- Lines stay private unless you share them
- Built by packaging veterans
- of rated speed, today
- 75%
- cans a day from one accumulator
- +36,544
- extra profit a day
- $18,272
- to pay back $150,000
- 9 days
Four machines: depalletizer, filler, labeler, casepacker. One 5-minute accumulator between the filler and labeler, two shifts a day, $0.50 profit per can. Every figure comes from the same engine you'd use.
The questions every plant gets asked.
More output, lower cost, and a payback finance will sign off on. LineIQ answers each one from the same model of your line.
- We need more cases per shift. Where do we start?
- LineIQ weighs speed and stops together to find the machine that's really limiting output. It isn't always the slowest one.
- Is a new machine worth it, or is there a cheaper fix?
- Compare a faster machine, fewer stops, an accumulator, or fewer operators against the same baseline, ranked by what each one earns.
- Finance wants a payback period.
- Every fix rolls into one investment, one extra profit per day and one payback period, in a PDF built for capital review.
- Every engineer has their own spreadsheet.
- Save lines and scenarios in one place, and send a read-only link to finance or leadership instead of a spreadsheet.
From the plant floor to the capital review.
Walk the line
Enter each machine's rated speed, stops per shift and repair time. Parallel machines and existing accumulators are supported.
See where output goes
Uptime compounds across the line, so you see true output per shift and which machine is holding it back.
Build the case
Test upgrades, accumulators and labor changes, compare scenarios side by side, and export the payback as a PDF.
Everything you need to justify the next project.
One model of your line, used for every decision: what to fix first, what it costs, and how fast it pays back.
Bottleneck finder
Finds the true constraint from speed and stops together, and shows how much output it's costing you.
Accumulator placement
Tests a buffer between every pair of machines. Often the cheapest fix, and the one most plants miss.
Upgrades and reliability
Price a faster machine or fewer stops on the same baseline, then combine fixes into one investment.
Labor savings
Count operators saved per shift at their wage plus benefits and taxes, alongside the throughput gain.
- Pro
Scenario comparison
Line up options side by side, such as a new filler against two accumulators, before you commit.
- Pro
Capital-review PDF
A one-page report with every number explained, ready to attach to a capital request.
Sometimes the cheapest fix isn't a new machine.
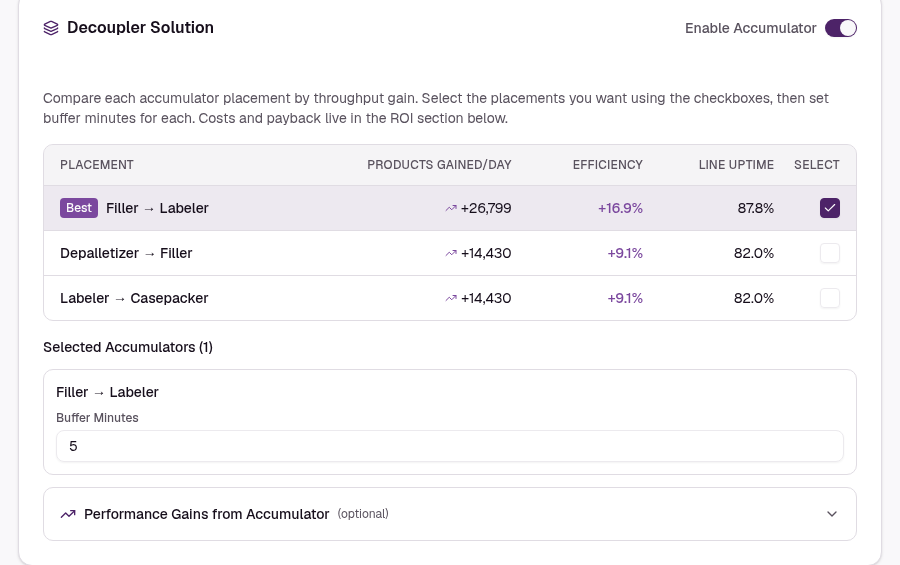
An accumulator in the right spot can be worth more than a faster machine. In the wrong spot it does almost nothing. LineIQ ranks every placement next to your upgrade options, so you know where the money goes before you spend it.
Pick the plan that fits how you work.
Free
$0
Unlimited line calculations with bottleneck and accumulator analysis. A good way to test your first line.
Start freePro
$49/month
For one engineer or plant manager. Saved lines, scenario comparison and capital-review PDF reports.
Get ProTeam
$99/seat/month
For a plant's engineering or CI group. A shared line library, templates, comments and a manager dashboard.
See Team
Common questions
- Do I have to share my production data?
- No. Lines you save are private to your account. Nobody else sees them unless you send a share link.
- Where do the numbers come from?
- From you: each machine's rated speed, stops per shift and average repair time. Downtime logs or a few shifts of observation are enough. The results are only as good as those inputs, so it's worth checking them with your operators.
- Can it handle our line layout?
- Yes. LineIQ supports parallel machines, existing accumulators and manual stations, and models each section between buffers separately.
- Can I send the results to a supplier?
- Yes. Send a read-only share link or the PDF report, so a supplier can quote against the same numbers you're using.
Find the hidden capacity in your line.
Analysis is free with an account. Pro adds unlimited saved lines, scenario comparison and PDF reports.
Sell packaging equipment instead? See LineIQ for equipment sellers