LineIQ Update: Project Boards, Custom PDF Reports & Pro+
See what's new in LineIQ: project boards, dashboards, customizable branded PDF reports, Pro+ with a 14-day free trial, and two packaging line features in beta.
LineIQ Team7 min read
LineIQ started as a packaging line ROI calculator. It's now a full workspace for building the case for a line improvement, getting it approved, and tracking the work after. This update covers project boards, dashboards, customizable PDF reports, the new Pro+ plan with a 14-day free trial, and two features in beta.
Project boards for every line improvement
Signing in now opens a workspace: a sidebar for everything you've saved, a search palette (press ⌘K or Ctrl K) that finds lines, customers and pages, and one-click access to a new line.
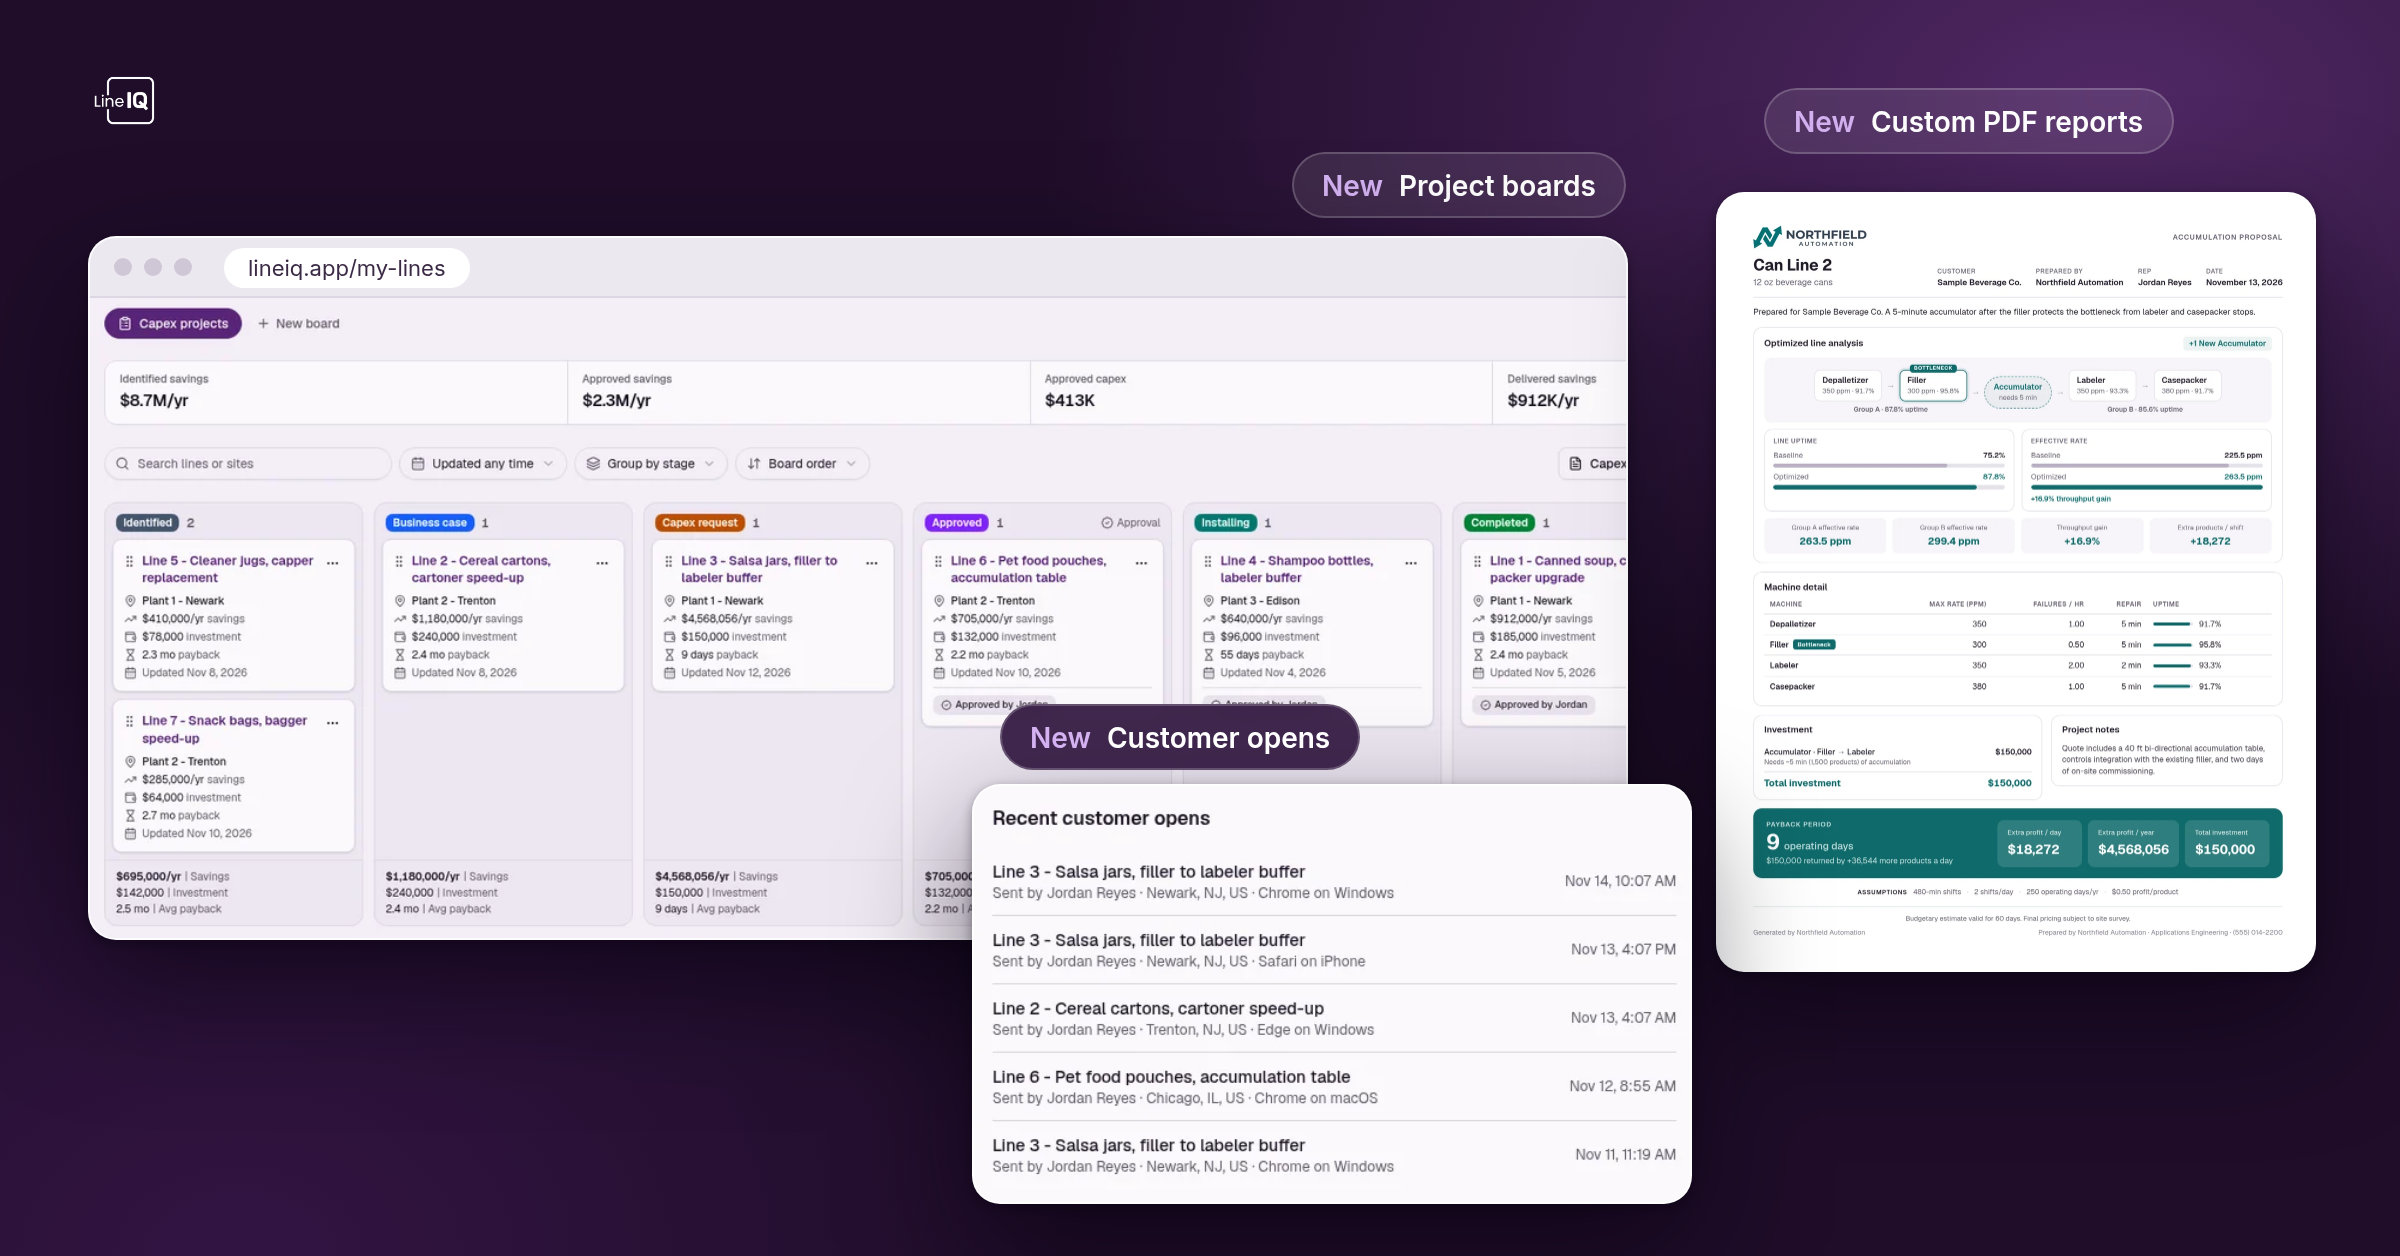
My Projects is now a board. Every saved line analysis is a card showing its site, yearly savings, investment and payback. Drag cards from stage to stage as projects move along. Each column totals its savings and investment.
Start with a simple project board, or add one built for the job: Improvement projects for moving capex requests through approval, or Line health for tracking the lines you run. Choose what each card shows, filter by date or stage, sort, export to CSV, or switch to a list view.
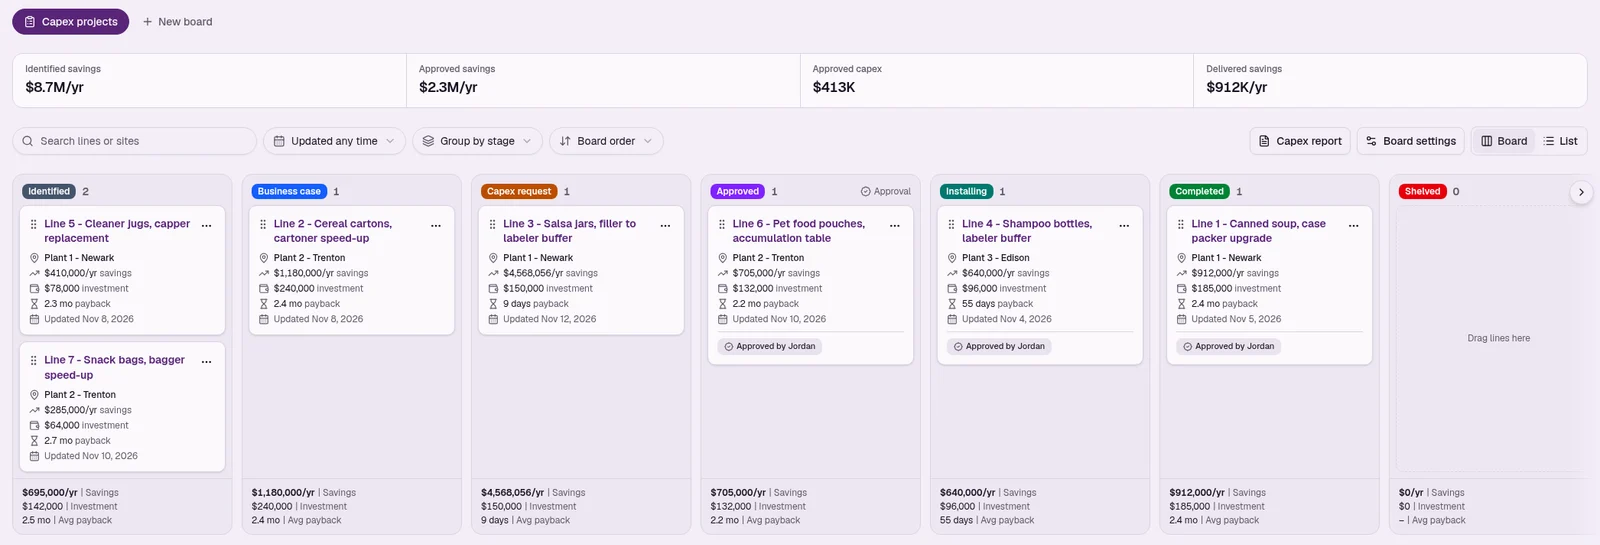 An Improvement projects board. Projects move from idea to approved capex to installed. Approved projects get a stamp, and the totals at the top show identified, approved and delivered savings.
Dashboards: pipeline, savings and customer opens
Pro users get a personal dashboard with savings in progress, savings on finished projects, and how this period compares to the last. On Pro+ and Team it also shows customer opens: each time someone opens a line you shared, with the city and device, so you know when to follow up. Teams see all of this across everyone, with a shared board.
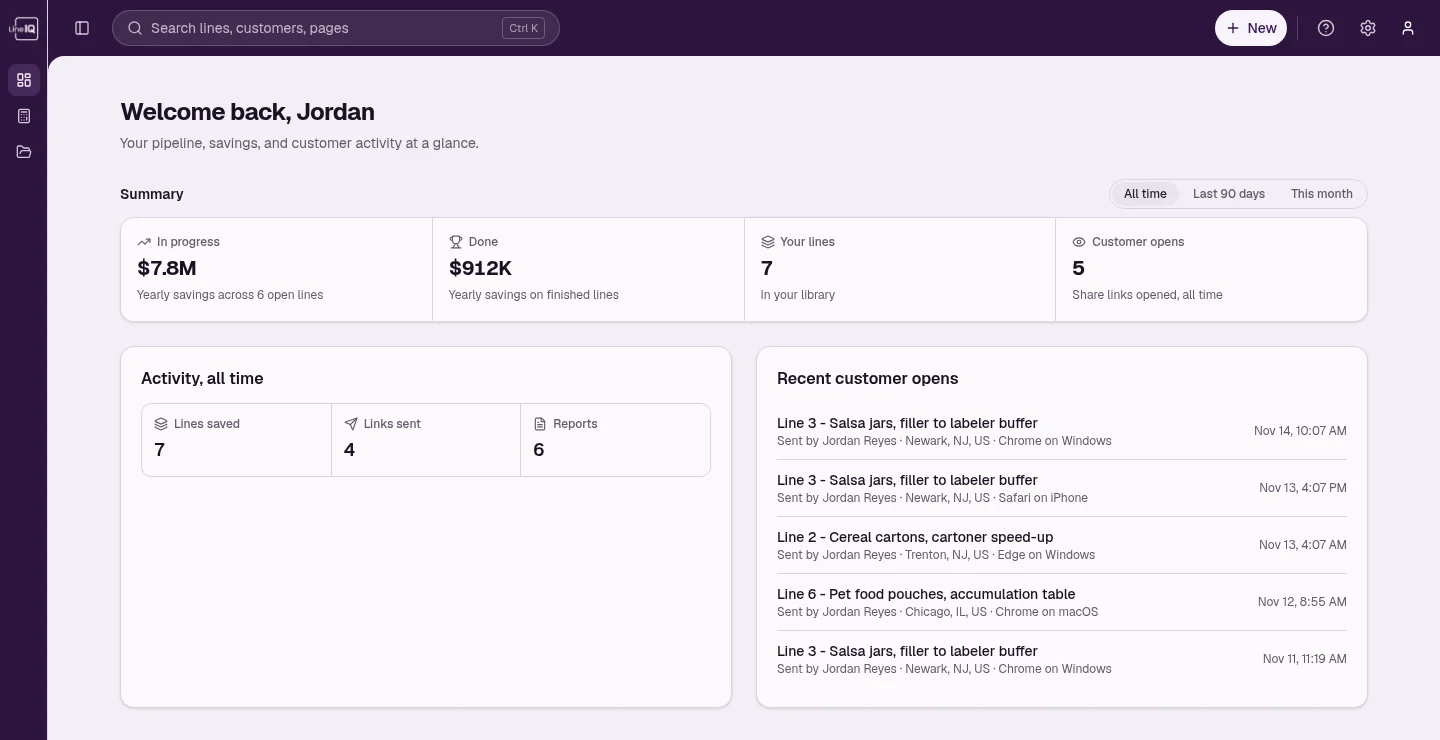 The dashboard on Pro+. Savings at a glance, your activity, and every time a customer opens a line you sent.
Customizable PDF reports with your branding
Reports are what get line improvements approved, so we rebuilt them from the ground up.
A one-page summary for approvals
The standard report now fits on a single US Letter page in the same style as the calculator. The line analysis comes first, then the machine table, the investment, and the payback figure at the bottom. Extra scenarios and insights move to an appendix, so page one stays readable for a plant manager or finance reviewer.
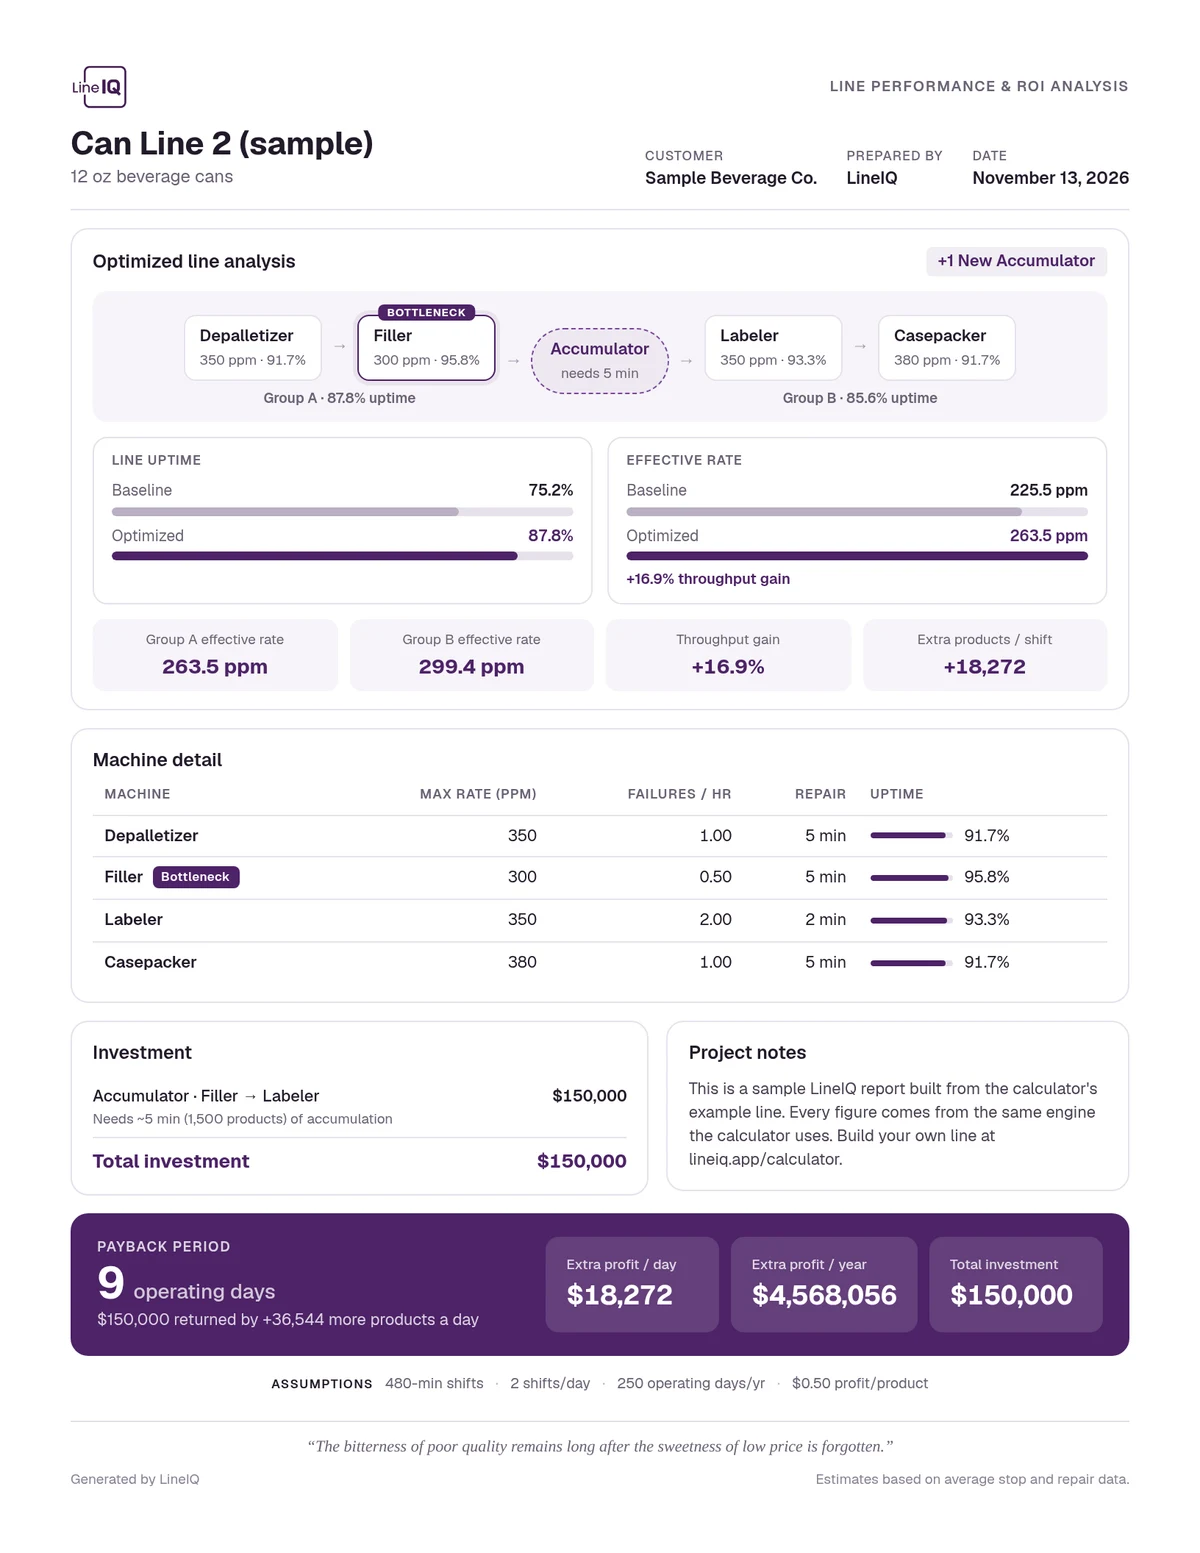 The one-page summary report. See the full version on the sample report page.
A detailed two-page report for engineers
When the line has an accumulator, you can also pick a detailed report. Page one shows today's line: the schedule, the machine table, and where the stop time and lost output come from. Page two compares every decoupler placement, then shows the optimized line, the investment and the payback.
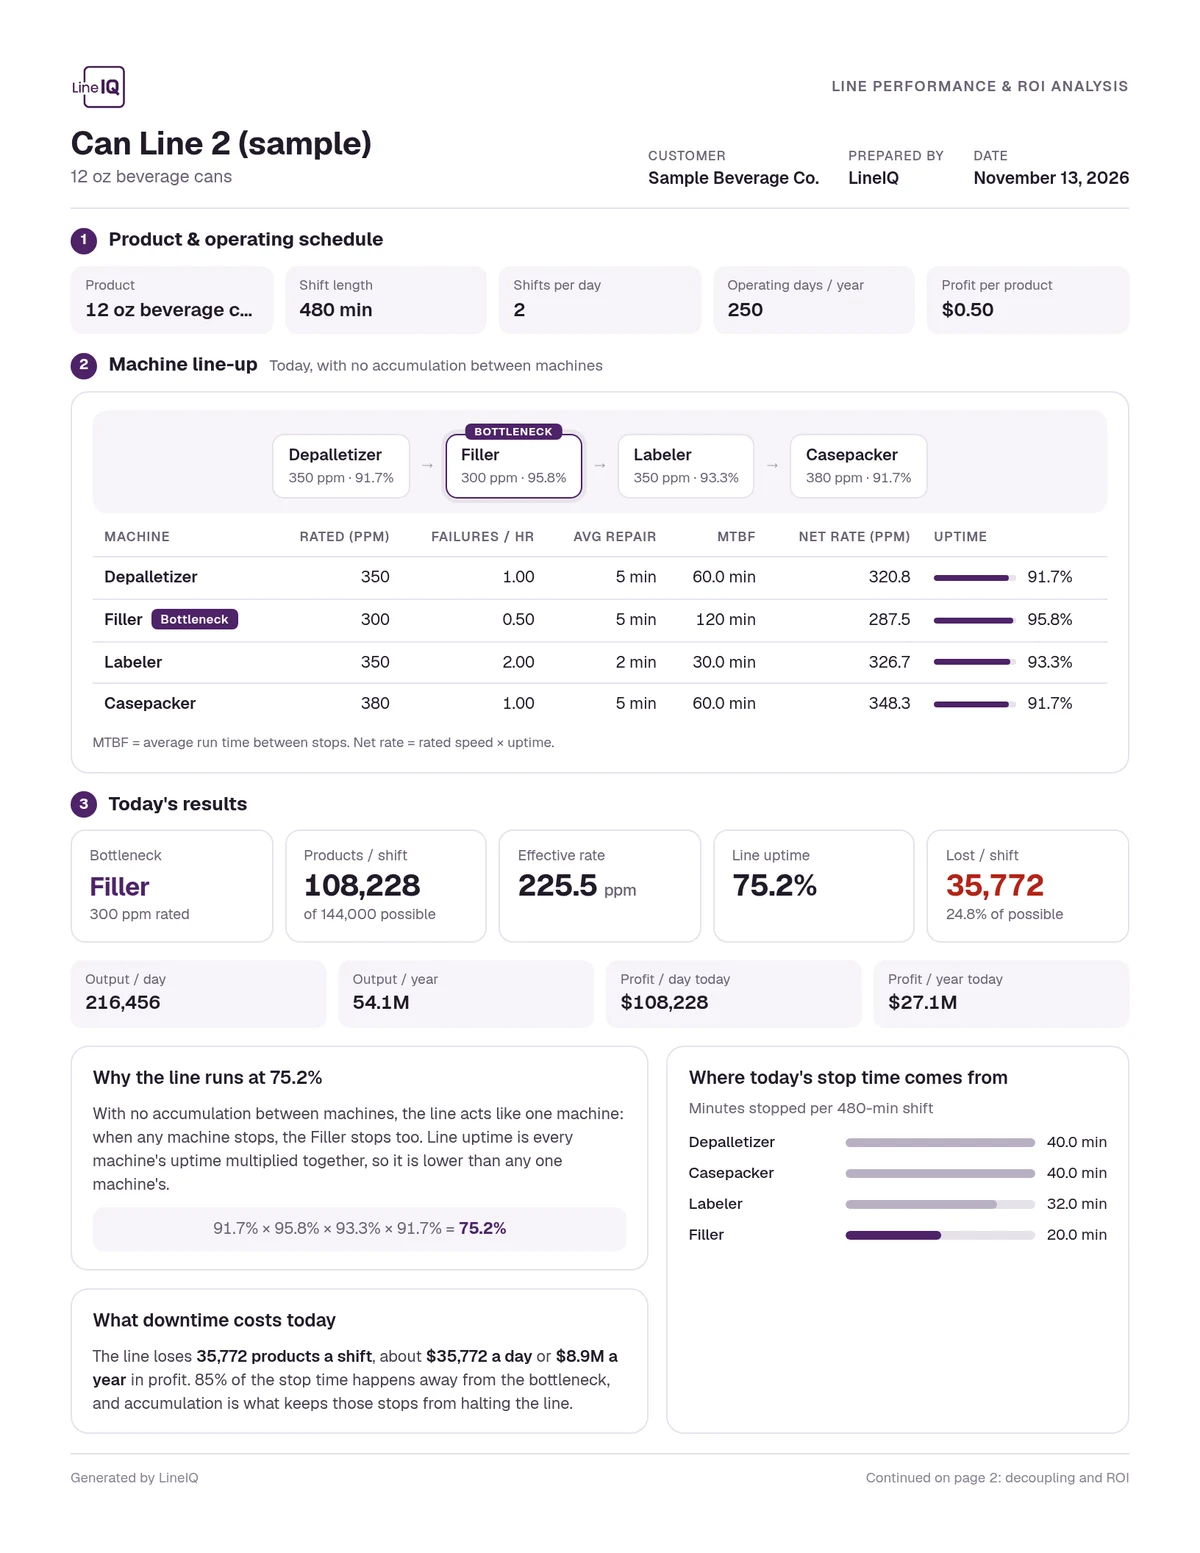 Detailed report, page one: today's line and what its stops cost.
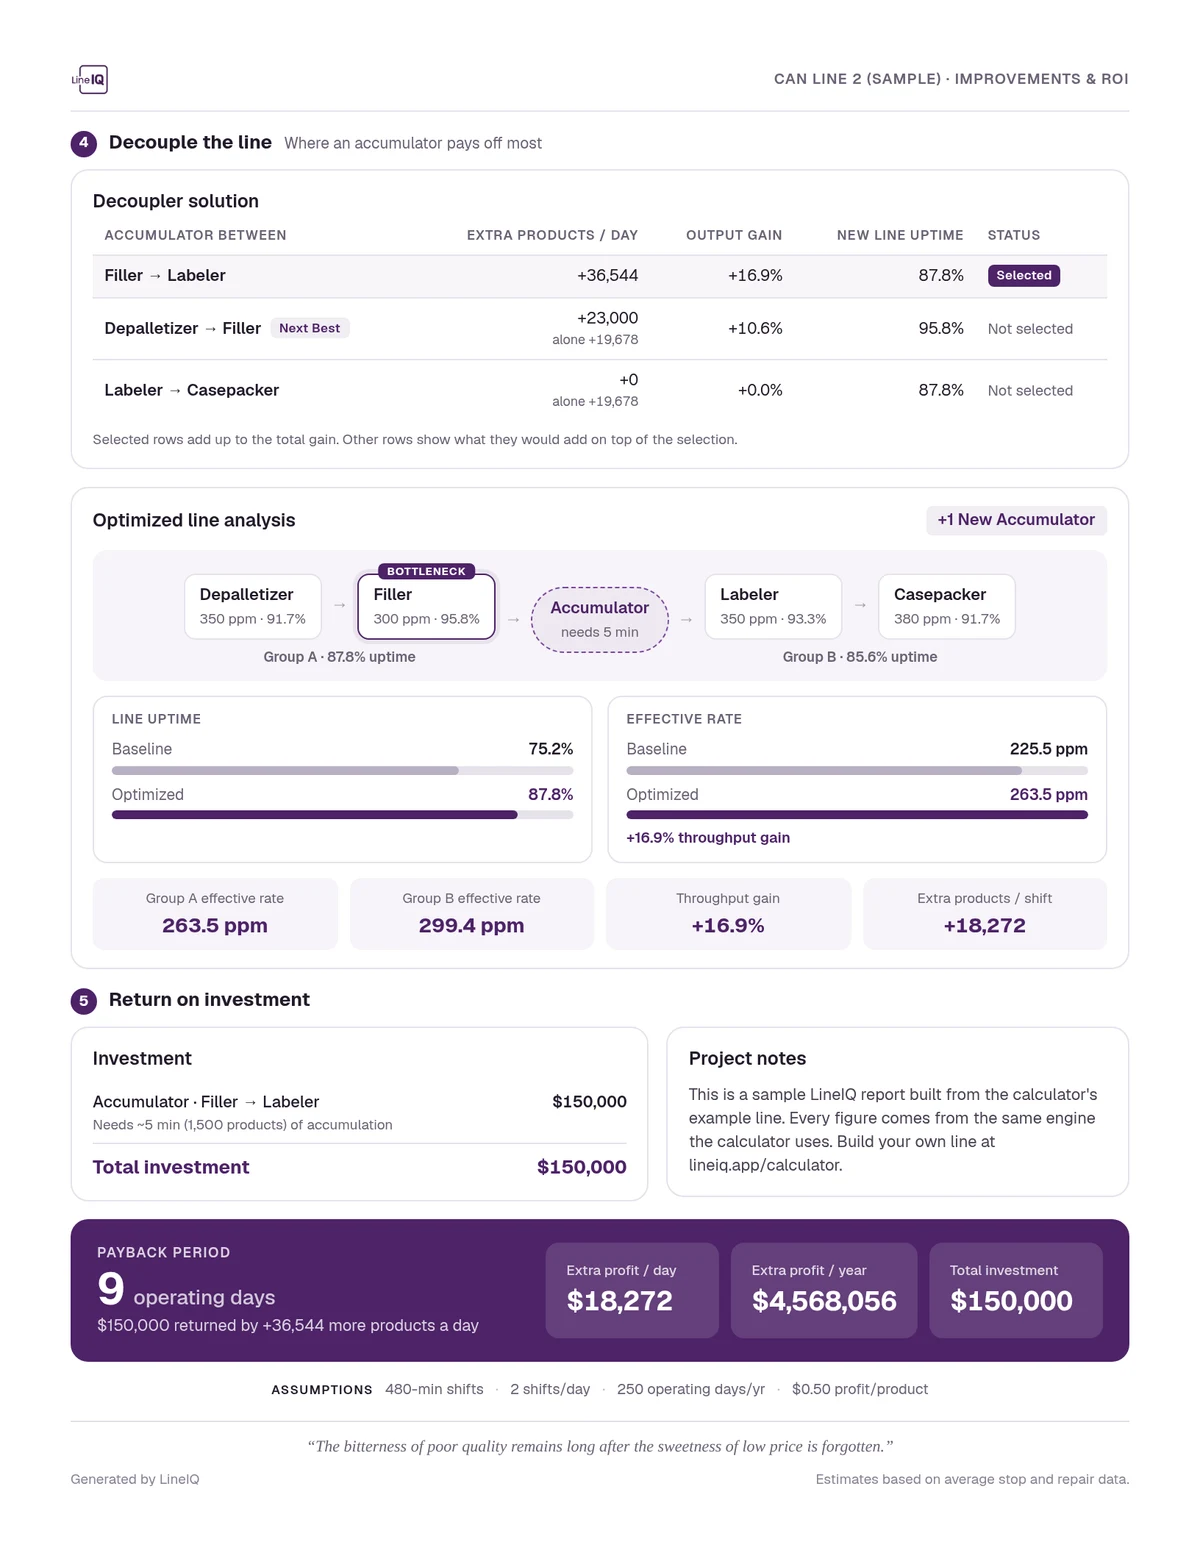 Detailed report, page two: decoupler placements, the optimized line and payback.
The PDF button remembers which type you used last, and every plan can create both. On the Free plan they carry a light watermark.
Make every report your own
On Pro+ and Team, the PDF reports page in Settings lets you set how every report looks, including the ones created from share links:
- Your logo and company name at the top in place of LineIQ's
- An accent color that matches your brand
- Your own title, such as "Equipment proposal" or "Capital request"
- An intro paragraph under the header, for example what the analysis covers and who to contact
- A footer disclaimer or terms line, like "Budgetary estimate valid for 60 days"
- A switch for each section, so you only show what your reader needs. Turning sections off gives the rest more room.
- A default report type for your team: one-page or detailed
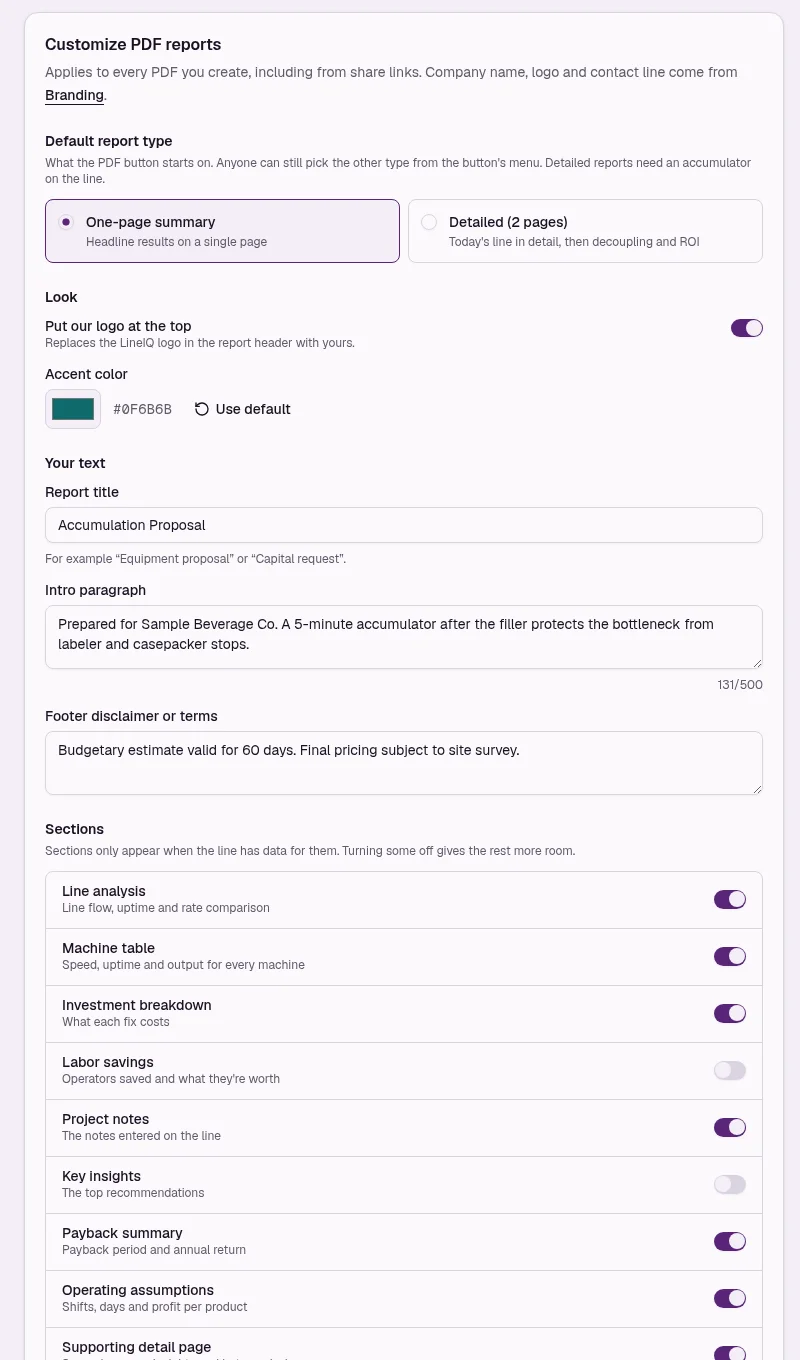 Settings › PDF reports. These settings produce the branded report below.
Here's the result for a fictional equipment supplier, Northfield Automation: their logo, a teal accent, an "Accumulation Proposal" title, a custom intro and terms, and the labor and insights sections turned off.
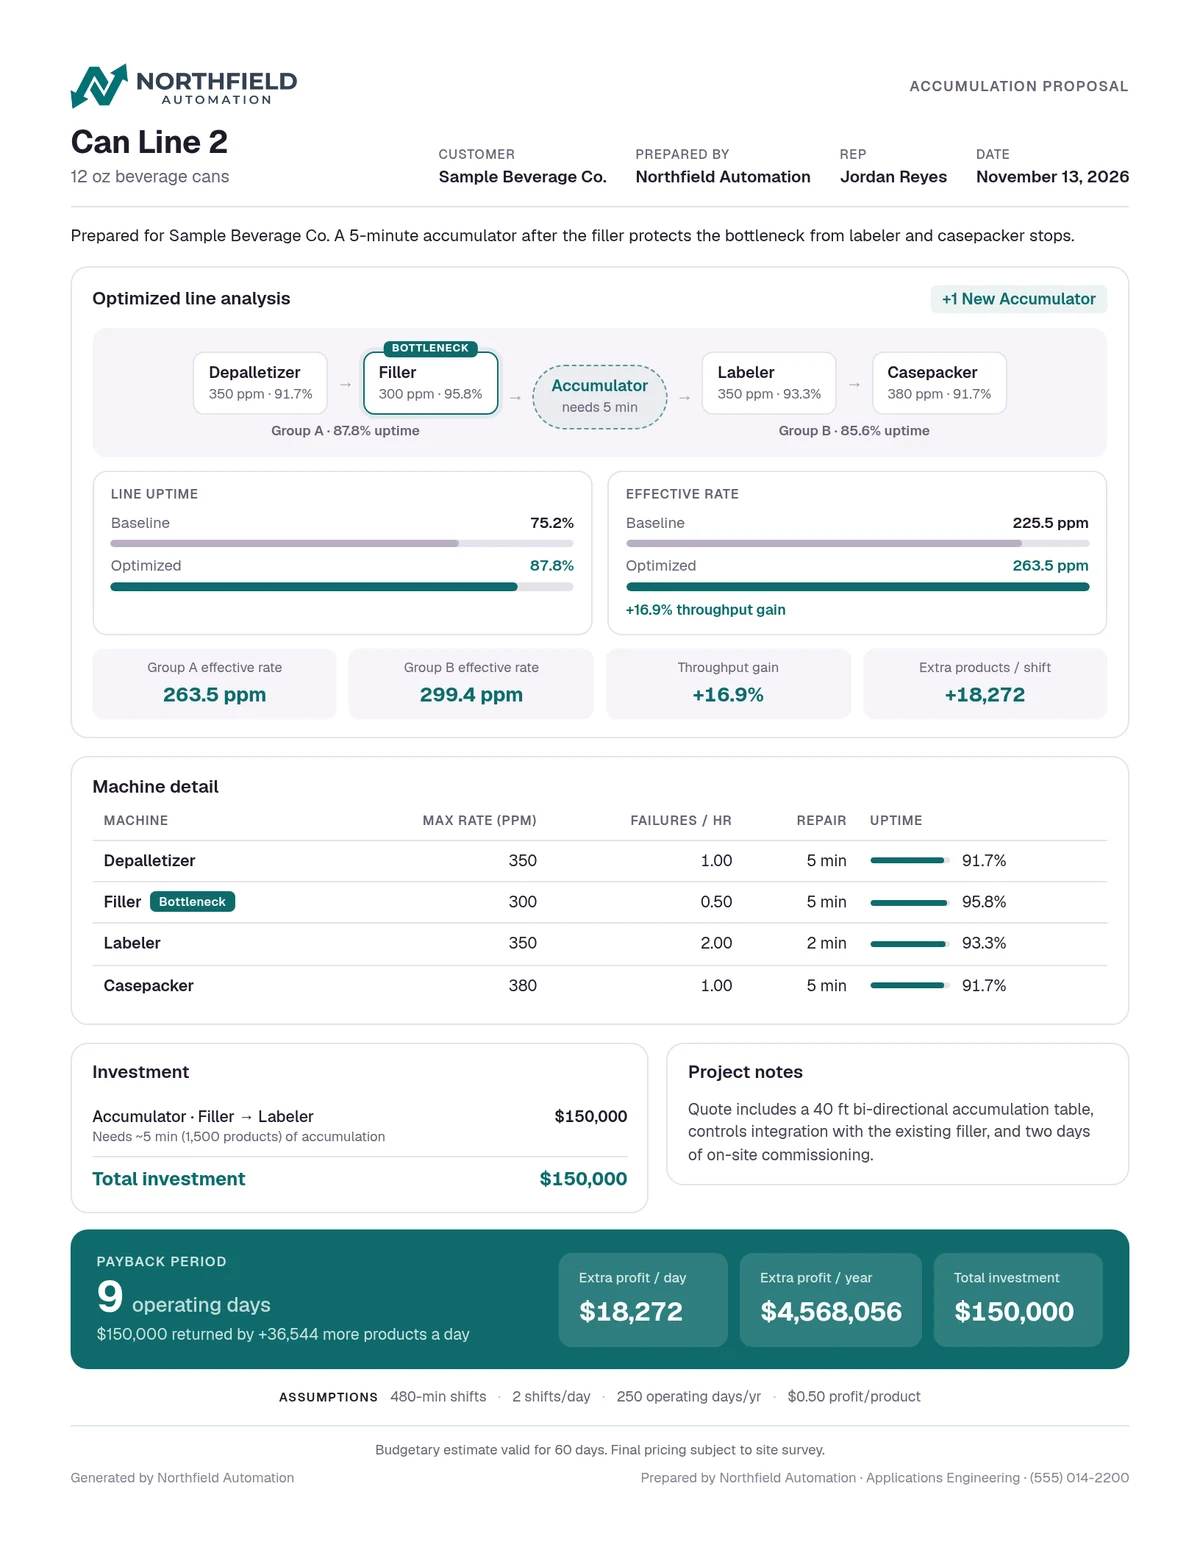 The same line analysis, branded and trimmed for a customer proposal.
Equipment sellers can send a proposal that looks like their own, and plant teams can match the format their capex committee expects.
Pro+, annual billing and a 14-day free trial
- Pro+ ($99/month) is a one-seat workspace for independent reps, consultants and solo engineers. It includes your branding on every PDF and share link, customizable reports, and share-link tracking. Add seats any time and it becomes a Team plan.
- Annual billing on every paid plan works out to about two months free.
- Try Pro or Pro+ free for 14 days.
See every plan side by side on the pricing page.
Dark mode
LineIQ now has a light theme and a dark theme, or it can follow your system setting. Pick one from your account menu.
Smaller improvements
- Apply a change to every scenario. Edit a value in one scenario and LineIQ asks whether to update just that one or all of them.
- Unlimited saved lines on Pro.
- Quicker sign-in. It opens in a popup instead of a new page, and you can reset a forgotten password by email.
- A new home at lineiq.app. Old links redirect automatically.
In beta: buffer time, line balance and new line business cases
These features work and are ready to try, but we're still refining them, so numbers may shift as we tune them. We'd love your feedback.
The beta calculator
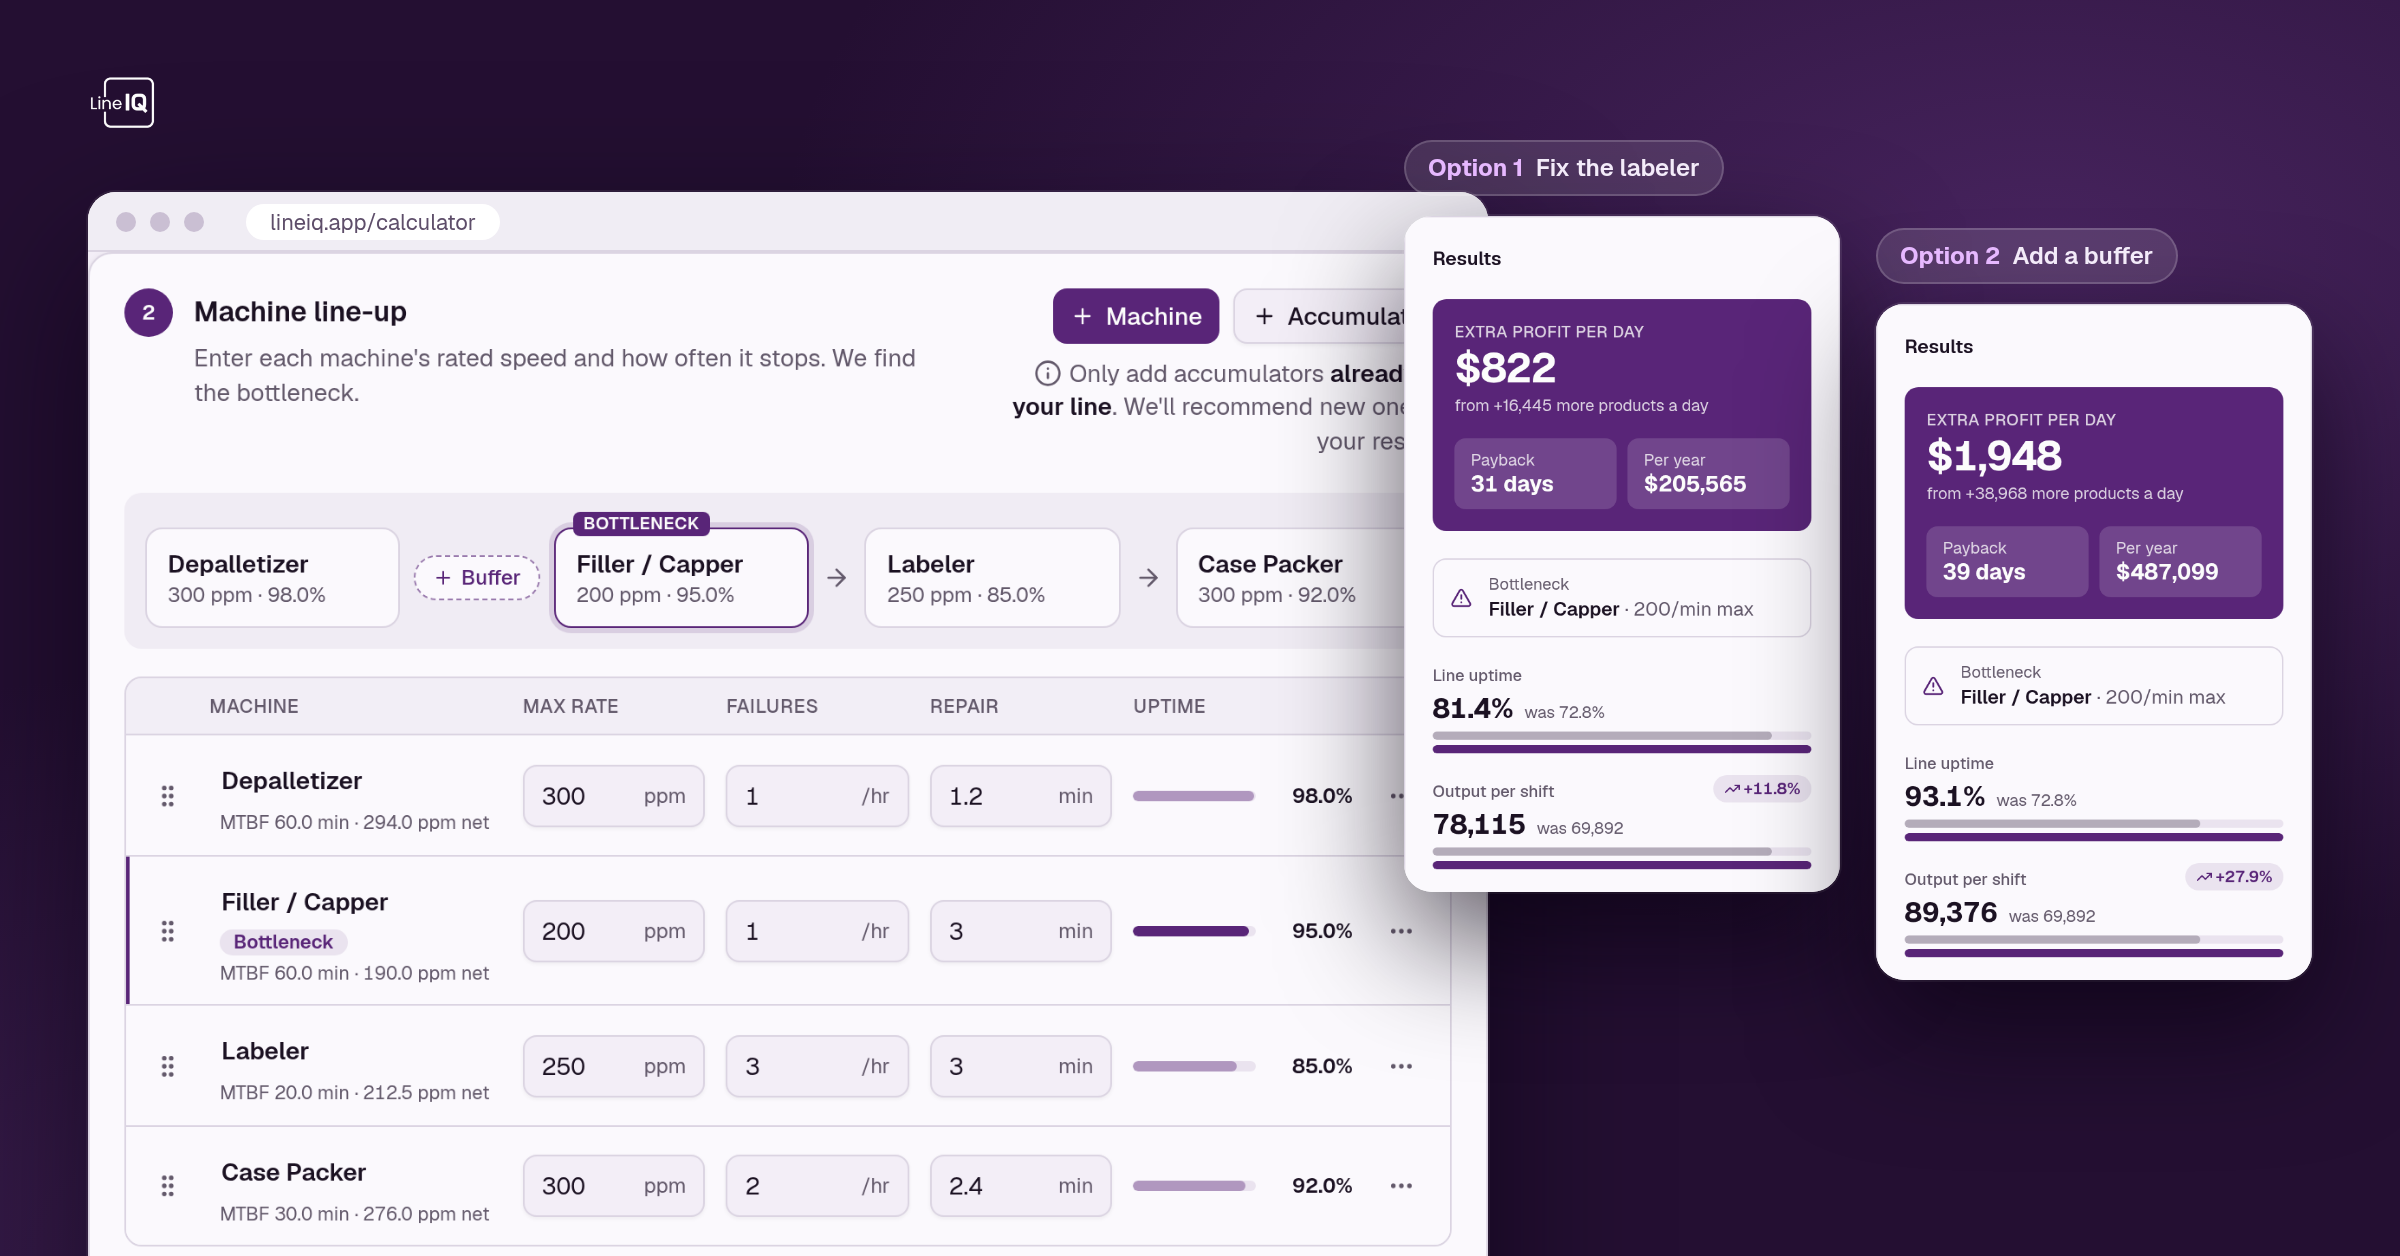
The beta calculator (also linked in the site footer) tests a new model of how buffers behave on a packaging line:
- Buffer-time modeling shows how many minutes each accumulator can carry the line through a stop, and whether that covers the repair times around it.
- New improvement options let you price replacing a manual station with automation, or switching a cartoner from tuck to glue cartons.
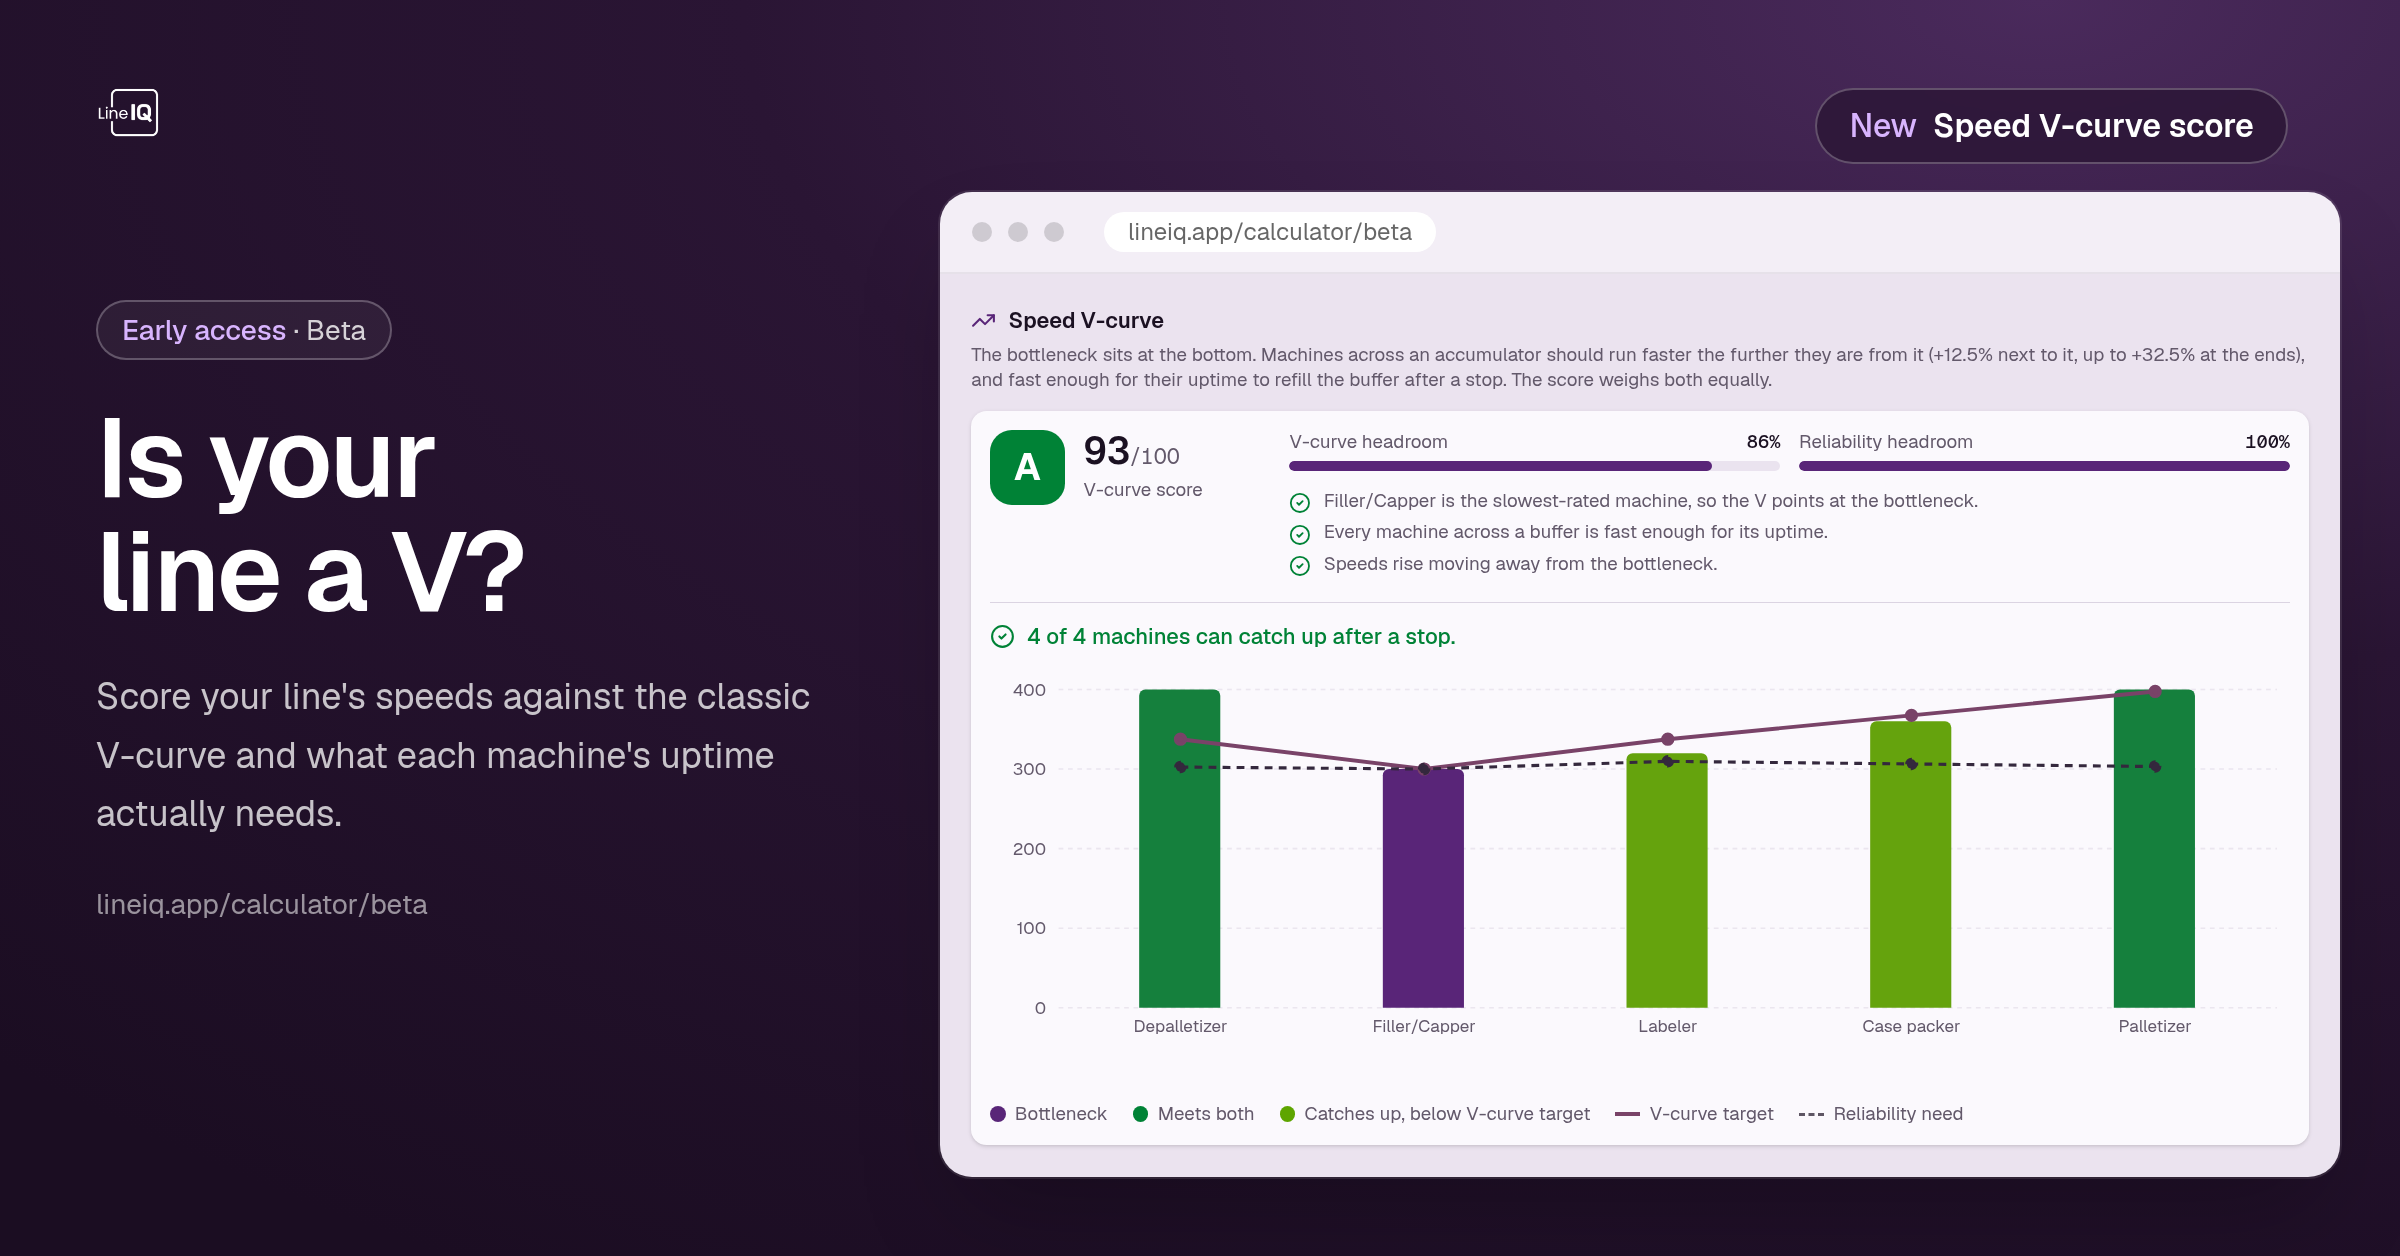
- Line balance advice tells you whether each accumulator should normally run full or empty to keep the bottleneck running, and how fast the machines around it need to go.
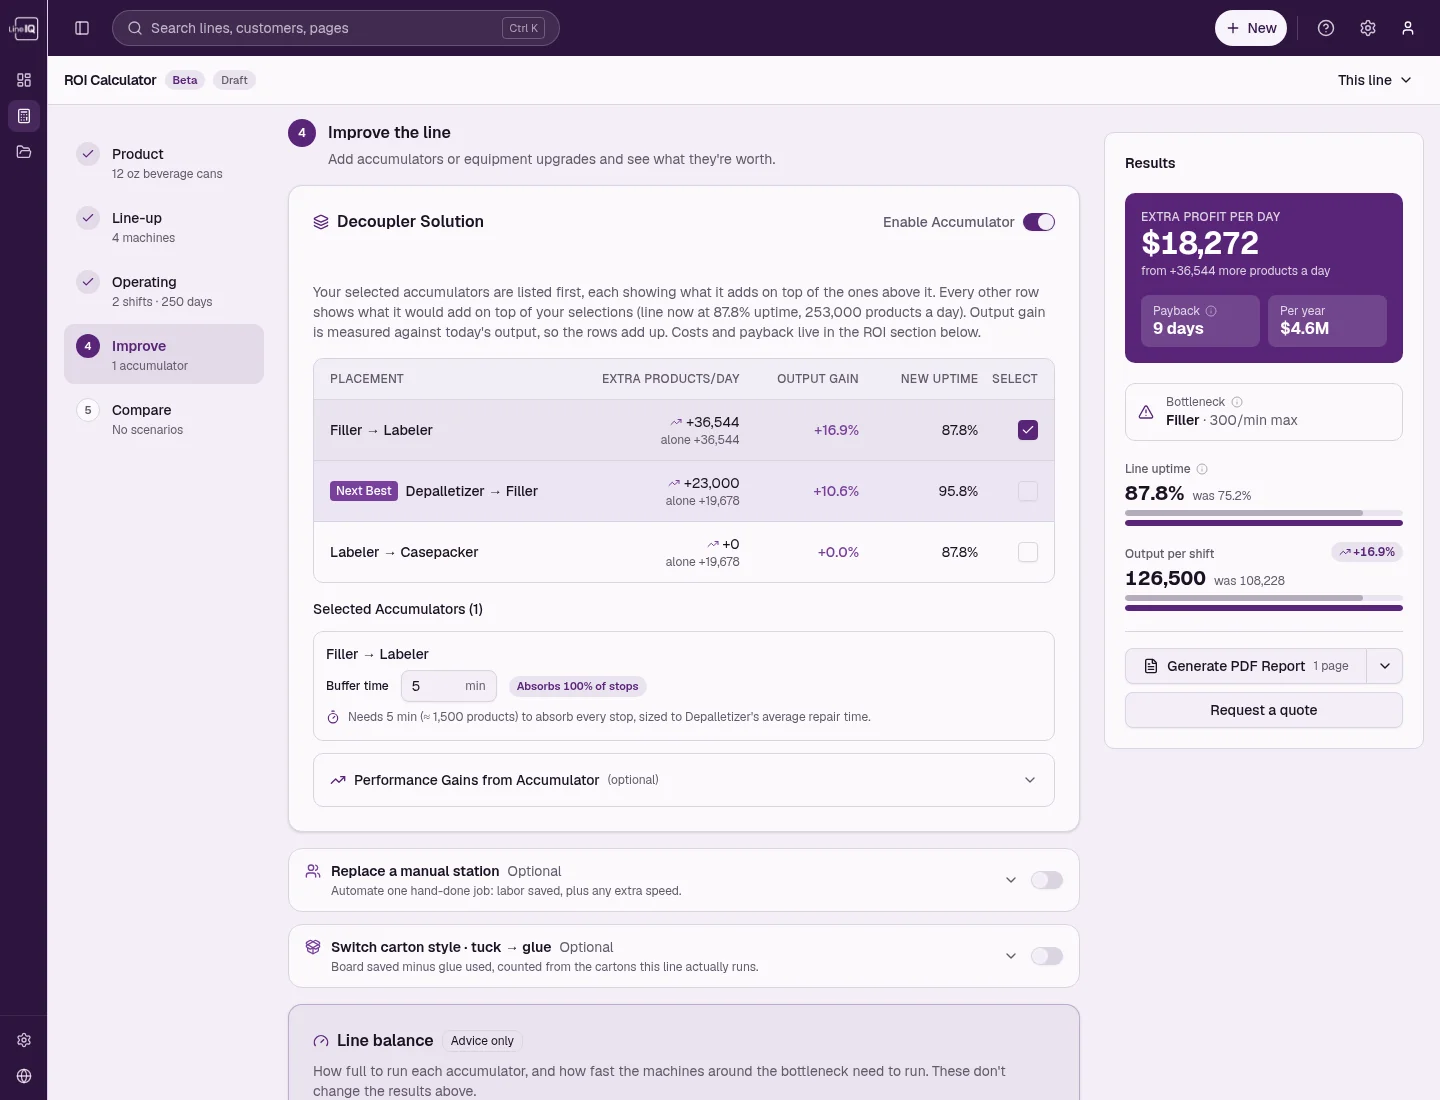 The beta calculator ranks every accumulator placement and sizes the buffer time for each one.
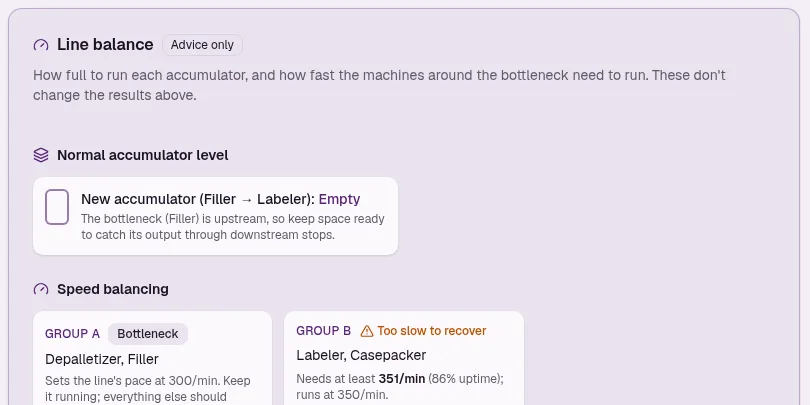 Line balance advice: how full to run each accumulator and which machines need more speed.
Business cases for a whole new line
For bigger decisions, like replacing a line, adding capacity or launching a new product, LineIQ builds the full financial picture on paid plans: NPV, IRR and payback year by year, depreciation schedules, ramp-up, and a sensitivity chart showing which assumptions matter most. Every case exports to a one-page PDF for your capex request. Start one from the New menu.
Frequently asked questions
Can I put my company logo on LineIQ PDF reports?
Yes. On Pro+ and Team, upload your logo in Settings › Branding, then turn on "Put our logo at the top" under Settings › PDF reports. Your logo, company name and contact line appear on every report, including ones created from share links.
What's the difference between the one-page and detailed reports?
The one-page summary is built for approvals: headline results, the machine table, investment and payback on a single page. The detailed report adds a full page on today's line and a comparison of every accumulator placement. It needs an accumulator on the line.
Is there a free trial?
Yes. Pro and Pro+ both include a 14-day free trial. You can cancel any time before it ends.
Where can I see an example report?
Open the example line to see a filled-in calculator alongside its one-page and two-page reports, or view the sample report on its own.
What's next
We're working on saved report templates, more ways to tailor the calculator for your team, and moving the beta model into the main calculator once it's proven out.
Something confusing or missing? Tell us. Most of what's in this post started as a customer request. Ready to try it? Build your first line or start a free trial.